A cladogram states branching order and nothing else — the length of a branch, the order of the tips, the shape of the layout all carry no information. This is what it does claim, how to read it, and where the word stops meaning the same thing as “phylogenetic tree”.
Quick answer
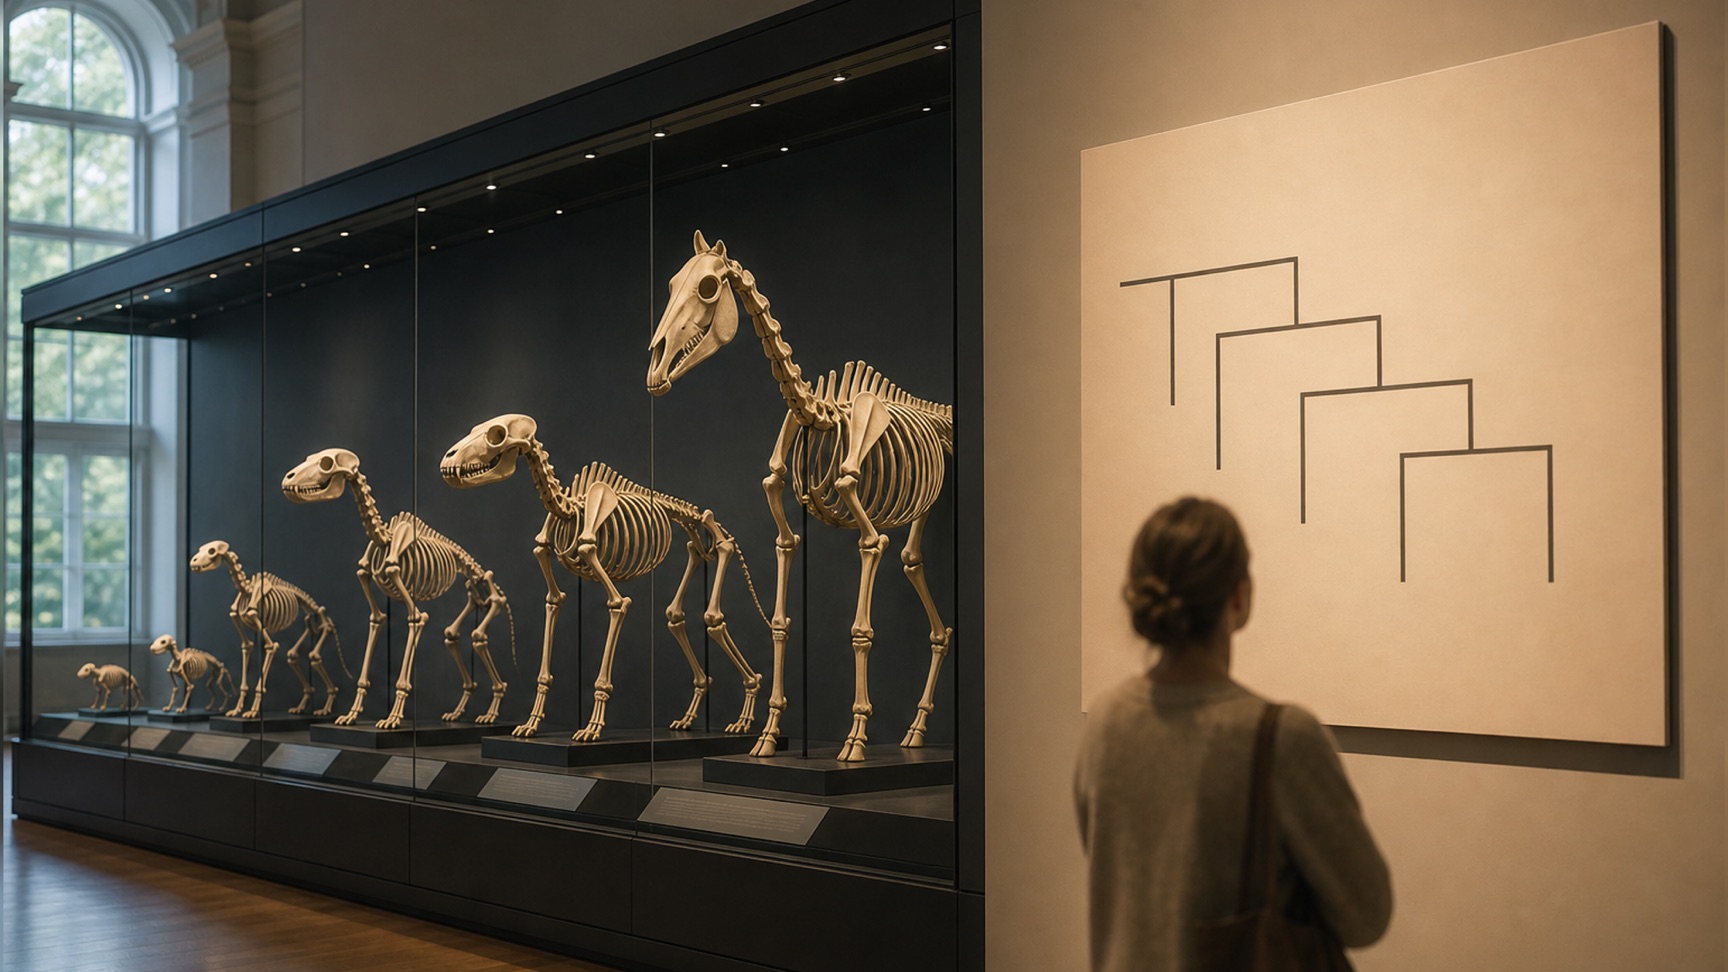
A cladogram states branching order only. Read the nesting: everything above a node shares a common ancestor not shared with anything outside it. Branch length, the vertical order of the tips and the layout style are drawing decisions, not claims — which is why a cladogram carries no scale bar, and why two diagrams that look nothing alike can be the same tree. A phylogram spends branch length on character change and a chronogram spends it on time; both then owe you a scale.
What does a cladogram show?
A cladogram states which taxa share a more recent common ancestor with each other than with anything else on the diagram. That is its entire content.
The tips are the taxa. Each node is the common ancestor of the lineages leaving it, and any node together with all of its descendants is a clade — a group consisting of an ancestor and all descendants of that ancestor. Two lineages leaving the same node are sister groups: in the Understanding Evolution material from the UC Museum of Paleontology, species A and B splitting from one node are each other’s closest relatives, and nothing else on the tree is closer to one than to the other.
Everything else on the page is layout. The horizontal length of a branch, the vertical order of the tips, whether the corners are square or slanted — a cladogram makes no claim through any of them. This is the same discipline a circuit diagram demands, where distance on the page means nothing and only connection means anything, and it fails in the same way: readers who are not warned trust the picture instead of the topology.
There is a second thing a cladogram is, which matters more than the vocabulary. It is a hypothesis. Understanding Evolution puts it plainly: the trees that come out of a cladistic analysis are only as good as the data that go into them, and new or better data can change the outcome, supporting a different hypothesis about how the organisms are related. A published tree is a result with an error bar, not a fact with a picture.
Cladogram, phylogram, chronogram: what branch length is claiming
Three diagrams share one topology and differ only in what they spend branch length on. The difference is the single most useful thing to know about tree figures, because it decides whether the horizontal axis is evidence or whitespace.
The practical test on any tree you are handed: look for a scale bar or an axis. If there is neither, the branch lengths are not evidence of anything and the only readable content is the nesting. If there is one, the lengths mean precisely what its units say and nothing beyond that — a long branch on a phylogram means a lot of inferred character change on that lineage, not that the organism at its tip is more advanced, more recent, or more successful.
Software treats the distinction as a switch rather than as a category. iTOL, the tree viewer at EMBL, displays a tree that contains branch length information as a phylogram by default; drawing the same tree as a cladogram means toggling its branch-length setting to Ignore. The file is unchanged. What changes is which of its numbers the figure is allowed to assert.
Is there a real difference between a cladogram and a phylogenetic tree?
Partly, and the honest answer is more useful than a clean one.
Understanding Evolution addresses the question directly, and its answer is that for general purposes there is not much difference: that site, along with many biologists, uses phylogeny, evolutionary tree, phylogenetic tree and cladogram interchangeably, all of them meaning a tree structure representing evolutionary relationships within a group. It then records the two narrower usages that some biologists do follow. To some, cladogram emphasises that the diagram is a hypothesis about evolutionary history while a phylogeny is the true history. To others, cladogram signals that the branch lengths are arbitrary, while in a phylogeny they indicate the amount of character change. Its verdict on both: these vocabulary differences are subtle and are not consistently used within the biological community.
So there are three defensible positions in the literature, and the term alone does not tell you which one an author holds. What does tell you is the figure. A tree with a scale bar in substitutions per site is making a claim about character change whatever its caption calls it; a tree with neither scale bar nor axis is a statement about branching order whatever its caption calls it. Read the axis, not the noun. Everything a tree adds once those branch lengths do carry a quantity — the scale bar, the support values at the nodes, the choice of root — is covered in our companion guide to reading a phylogenetic tree.
Two other words show up in the same slot. A phylogram is the length-carrying tree in the second sense above. A dendrogram is the general term for any branching diagram, including ones built by clustering methods that make no evolutionary claim at all — a heatmap’s row dendrogram is not a phylogeny, and treating it as one is a category error rather than a vocabulary preference.
There is a real school behind the strict usage, which is why the term persists. The Willi Hennig Society, founded in 1980 as a forum for advancing phylogenetic systematics, publishes the journal Cladistics; and formal clade names have their own code, the International Code of Phylogenetic Nomenclature — the PhyloCode — whose Version 6 was ratified on 20 January 2019 by the Committee on Phylogenetic Nomenclature of the International Society for Phylogenetic Nomenclature. When a systematist insists on cladogram, they are usually speaking from inside that tradition rather than being fussy.
The parts of a cladogram: root, node, branch, tip, clade, outgroup
Six terms, and the point of each is what it licenses you to say.
The root is the base of the tree, the common ancestor of everything shown. A tree without one has a shape but no direction, and none of the words below work without direction.
A node is a branch point: the last common ancestor of the lineages leaving it. Its content is the set of taxa above it, not its position on the page.
A branch is a lineage between two nodes. On a cladogram, its length is layout.
A tip is a taxon. Understanding Evolution’s tree-building rules are strict about this: all taxa go on the endpoints of the tree, never at nodes. A drawing that puts a living species at an internal node is claiming that species is the ancestor of the others, which is almost never what the analysis found.
A clade is a node plus all of its descendants. This is the unit phylogenetic classification names — and its consequence for familiar groups is larger than it sounds. Because the bird lineage branches off within the dinosaur lineage, phylogenetic classification places birds inside Dinosauria. If a group you were taught as a category is not a clade, no cladogram will show it as one.
An outgroup is a taxon outside the group of interest, included so the tree has a direction. Every member of the group of interest is more closely related to the others than to the outgroup, so the outgroup stems from the base of the tree. Its working job is polarity: it is often reasonable to treat the outgroup’s character states as the ancestral states for the group being studied, which is what makes derived a meaningful word further up.
One more, because it is the part most often read wrongly. A polytomy is a node with more than two descendant lineages — a pitchfork. It usually means the data are not sufficient to resolve how those lineages are related, and the authors are telling you not to draw a conclusion there. Occasionally it is a positive claim that several lineages split at effectively the same time, in which case the paper should say so. Among Lake Malawi cichlids, which diversified so fast that biologists use them to refine phylogenetic methods, some genuinely hard polytomies may never resolve.
How do you read a cladogram?
In this order.
Find the root and face the tree. Everything else is relative to it.
Read nesting, not neighbours. At each node, everything above it shares an ancestor not shared with anything outside it. Two taxa drawn adjacent are not therefore related — check whether the node joining them encloses only them.
Name the sister groups. For any taxon, its sister is the lineage leaving the same node. That relation, not proximity on the page, is what the tree asserts.
Find the outgroup. It tells you which end is ancestral and therefore what derived means for every character marked on the diagram.
Check the nodes for support. In a Newick file, the numbers that sit at the
internal nodes are support values while the numbers after colons are branch
lengths: iTOL documents (A:0.1,(B:0.1,C:0.1)90:0.1)98:0.3); as a tree with
branch lengths 0.1 and 0.3 and bootstrap values 90 and 98. Whether those
support values are drawn on the figure is the author’s choice, and their absence
on a published tree is worth noticing.
Read the polytomies as uncertainty unless the text says otherwise.
Ignore tip order and branch length, unless there is a scale bar or an axis telling you the lengths mean something.
Two drawings that look nothing alike can be the same tree
The branches at any node can be rotated freely, and the layout can change completely, without altering a single relationship. iTOL alone offers six display modes: rectangular, slanted, circular, curved branches, and unrooted radial in equal-angle and equal-daylight variants.
The test for whether two trees agree is therefore not visual. Two diagrams are the same tree when every node in one encloses the same set of taxa as a node in the other. Anything else — tip order, silhouette, whether the thing is drawn as a fan or a ladder — is presentation.
This matters when you compare a published tree with your own. Two figures that look different may agree completely, and two that look similar may disagree at exactly the node your argument rests on.
How a character matrix becomes a tree
Cladistics is a method for hypothesising relationships from character data, which may be anatomical, physiological, behavioural or molecular. It rests on three assumptions, stated in the Understanding Evolution material: that characters change over time, so that the original state can be called plesiomorphic and the changed state apomorphic; that any group of organisms is related by descent from a common ancestor; and that lineage splitting is bifurcating. That third assumption is the one with known exceptions — simultaneous splits, and interbreeding between distinct groups, which happens at least occasionally in some groups such as plants.
The procedure has six steps, and the fourth is where most hand-drawn trees go wrong.
Choose taxa that are themselves clades; they will be the tips. Score characters that look like homologies, inherited from a common ancestor, and not analogies, which arrived by convergence — the dorsal fins of sharks and dolphins are the standard example of what to leave out. Determine the polarity of each character, usually by taking the outgroup’s states as ancestral or by reading fossils. Then group taxa by synapomorphies, shared derived states, and never by symplesiomorphies, shared ancestral states. Resolve conflicts by a clearly stated method, usually parsimony. Draw the result.
The synapomorphy rule is worth restating with its own example, because it is counter-intuitive. If a beetle clade’s common ancestor had five antennal segments and seven modern species still do, while one lineage evolved six segments and passed that to fourteen species, then the fourteen with six segments form a group and the seven with five segments do not. Sharing an ancestral state is not evidence of relationship. Only the change is.
Three drawing rules come with the method, and they are what makes a tree readable as an argument. All taxa sit at the endpoints, never at nodes. Every node carries the synapomorphies common to everything above it. And each synapomorphy appears once, unless the character state genuinely arose more than once by parallelism.
Parsimony decides between trees that both fit the data: all else equal, the best hypothesis is the one requiring the fewest evolutionary changes. The textbook comparison uses exactly the vertebrate characters above — one hypothesis requiring six changes, another requiring seven because a bony skeleton has to evolve independently twice. Both fit; parsimony prefers the first.
Real analyses are much larger than the matrix above, and it is worth knowing by how much. One reconstruction of relationships among 499 lineages of seed plants began with more than 1,400 molecular characters. A five-by-four matrix teaches the logic; it is not the scale at which the method is used.
Five ways a cladogram gets misread
Reading it as a ladder of progress. Nothing at the right-hand edge is more advanced than anything else there. Where every tip is a living taxon, all of them are equally distant from the root in time, and a tree that mixes living taxa with fossils is explicit about which tips are which. The vertical position of a tip is layout either way.
Reading branch length without a scale. Covered above, and the most common figure-level error in student work.
Treating a taxon at a node as an ancestor. Taxa belong at endpoints. If a drawing shows one at a node, either the drawing is wrong or it is asserting something extraordinary.
Grouping by shared ancestral states. Grouping the beetles with five antennal segments feels natural and is not evidence. This is the error the synapomorphy rule exists to prevent, and the term for those non-groups is worth knowing when you meet it in a review: they are not clades.
Reading a polytomy as a claim of simultaneous splitting. Usually it is an admission that the data cannot resolve the node.
A sixth, less about reading than about vocabulary: primitive and derived are still current, but many biologists avoid primitive because it suggests simpler and inferior. Losses are derived too — for snakes, having legs is the plesiomorphic state and lacking them is the apomorphic one.
Drawing a cladogram for a paper, thesis or poster
A tree figure fails in production for generic reasons, not phylogenetic ones. It is mostly hairlines and small type, which is exactly the combination that breaks when a figure is scaled to column width. Two publishers, two very different sets of numbers for the same drawing:
| Requirement | Nature branded research journals | PLOS ONE |
|---|---|---|
| Figure width | 88 mm single column, 180 mm double column for research content | 789–2250 px at 300 dpi, i.e. 6.68–19.05 cm; ≤ 13.2 cm to match the PDF text column |
| Lettering | Sans-serif, preferably Helvetica or Arial; minimum 5 pt, maximum 7 pt | Arial, Times or Symbol only, 8–12 pt |
| File format for line art | Vector: AI, EPS or PDF. Bitmap formats are not accepted for vector art | TIFF or EPS only |
| Resolution | Bitmapped elements at 300 dpi or the native resolution if lower | 300–600 dpi |
| File size | Up to 50 MB per final figure | Under 10 MB |
| Colour mode | RGB for original research; CMYK for other content | Not specified on the figures page |
| Captions | Not specified in the artwork guide | In the manuscript, not inside the figure file |
Two things follow for a tree specifically. The first is that the same figure cannot satisfy both without being rebuilt: a tree lettered at 6 pt for Nature is below the PLOS minimum of 8 pt, and a tree lettered at 10 pt for PLOS is above Nature’s maximum of 7 pt. Decide the target journal before you set the type, or keep the labels editable so the decision is cheap to revisit — which is the practical argument for vector output, and the one thing both publishers agree on for line art. Our guide to making scientific figures covers the general version of this, and the Scientific Reports figure requirements page works through what a Nature Portfolio submission needs in detail.
The second is what neither publisher says. Nature’s artwork guide and the PLOS ONE figures page are both silent on phylogenies as a figure type: no rule about where support values sit, none about scale bars, none about whether the underlying tree file or alignment must be deposited alongside the figure. Those conventions come from the systematics literature and from individual journals’ own instructions rather than from a general artwork guide. We could not verify the instructions of the two specialist journals most affected — Systematic Biology and Cladistics both refused automated access while this page was written — so if you are submitting there, read their author instructions directly rather than assuming the generic specifications transfer.
What does transfer, from the reading rules above:
Give the outgroup a position that reads as the base, not a tip buried in the middle of the list.
Put support values where a reader can attach them to nodes, and state in the legend what they are — bootstrap percentages and posterior probabilities are different quantities on the same scale.
Include the scale bar if and only if branch lengths mean something. A scale bar on a cladogram is a claim you did not make; a phylogram without one is a claim you cannot check.
Say in the legend what the tree is a hypothesis from — which characters or which alignment, which method, which software. The tree is the conclusion of an analysis, and a figure that hides the analysis is a picture.
Frequently asked questions
What is a cladogram? A branching diagram of hypothesised relationships among a set of taxa. The tips are the taxa, each node is the common ancestor of the lineages leaving it, and any node plus all its descendants is a clade. It states branching order; branch length, tip order and layout style carry no information.
What is the difference between a cladogram and a phylogenetic tree? It depends on the author. Understanding Evolution states that for general purposes there is not much difference, and that it and many biologists use the terms interchangeably; it also records two narrower usages — one where cladogram marks the diagram as a hypothesis, one where it marks the branch lengths as arbitrary — and notes that neither is used consistently across the field. In software the second usage is the operative one: iTOL shows a tree with branch lengths as a phylogram by default, and a cladogram means ignoring those lengths.
What do the branch lengths on a cladogram mean? Nothing. A cladogram spends horizontal space on lining up the tips, which is why it carries no scale bar. A phylogram spends it on character change and a chronogram on time, and both then owe you a scale.
How do you read a cladogram? Find the root, read the nesting rather than adjacency, name the sister groups, locate the outgroup, check the nodes for support values, treat polytomies as uncertainty, and ignore tip order and branch length unless a scale says otherwise.
What is an outgroup in a cladogram? A taxon outside the group of interest, which therefore stems from the base of the tree. Its job is polarity: its character states are often taken as the ancestral states for the group, which is what makes derived meaningful.
Can two cladograms that look completely different show the same relationships? Yes. Branches rotate freely at any node and layouts vary — iTOL offers six display modes. Two trees are identical when every node encloses the same taxa, regardless of how they look.
How do you build a cladogram from a character table? Choose taxa that are clades, score homologies rather than analogies, set polarity from the outgroup, group by synapomorphies and never by symplesiomorphies, resolve conflicts by parsimony, and draw the result with all taxa at endpoints and each synapomorphy marked once.
Where to go next
- The CONSORT 2025 flow diagram — another diagram whose shape is the argument, and what happens when a standard revises the wording inside the boxes.
- The PRISMA 2020 flow diagram — how to fill in a diagram whose boxes are specified for you, and what its numbers have to add up to.
- Scientific Reports figure requirements — the specifications a Nature Portfolio submission is held to, including the ones the journal does not publish itself.
참고 자료
- Understanding Evolution — Reading trees: A quick review — University of California Museum of Paleontologyhttps://evolution.berkeley.edu/phylogenetic-systematics/reading-trees-a-quick-review/2026년 8월 17일 확인
- Understanding Evolution — Phylogenetic pitchforks — University of California Museum of Paleontologyhttps://evolution.berkeley.edu/phylogenetic-systematics/reading-trees-a-quick-review/phylogenetic-pitchforks/2026년 8월 17일 확인
- Understanding Evolution — Reconstructing trees: Cladistics — University of California Museum of Paleontologyhttps://evolution.berkeley.edu/phylogenetic-systematics/reconstructing-trees-cladistics/2026년 8월 17일 확인
- Understanding Evolution — Reconstructing trees: A step by step method — University of California Museum of Paleontologyhttps://evolution.berkeley.edu/phylogenetic-systematics/reconstructing-trees-cladistics/reconstructing-trees-a-step-by-step-method/2026년 8월 17일 확인
- Understanding Evolution — Reconstructing trees: Parsimony — University of California Museum of Paleontologyhttps://evolution.berkeley.edu/phylogenetic-systematics/reconstructing-trees-cladistics/reconstructing-trees-parsimony/2026년 8월 17일 확인
- Understanding Evolution — Using trees for classification — University of California Museum of Paleontologyhttps://evolution.berkeley.edu/phylogenetic-systematics/using-trees-for-classification/2026년 8월 17일 확인
- iTOL — Interactive Tree Of Life, help pages — European Molecular Biology Laboratoryhttps://itol.embl.de/help.cgi2026년 8월 17일 확인
- International Code of Phylogenetic Nomenclature (PhyloCode), Version 6 — International Society for Phylogenetic Nomenclaturehttp://phylonames.org/code/2026년 8월 17일 확인
- The Willi Hennig Society — Willi Hennig Societyhttps://cladistics.org/2026년 8월 17일 확인
- Nature branded research journals — Guide to preparing final artwork — Springer Naturehttps://www.nature.com/documents/NRJs-guide-to-preparing-final-artwork.pdf2026년 8월 17일 확인
- PLOS ONE — Figures — Public Library of Sciencehttps://journals.plos.org/plosone/s/figures2026년 8월 17일 확인
본문에 등장하는 저널·학회·제품 이름은 각 권리자의 상표입니다. 이 페이지는 독립적인 편집 콘텐츠이며 해당 기관과 제휴·승인·보증 관계가 없습니다. 사양은 변경됩니다. 투고하거나 인쇄하기 전에 위에 링크된 공식 출처에서 각 요건을 확인하세요.