
Graphical Abstract Maker
Paste your abstract or upload the paper PDF — the AI graphical abstract generator distills your key findings into a single clear visual flow, editable down to every label.
Graphical Abstract Style
Three visual styles and five layout structures, each shown with a real example — click a card to apply it (style and layout combine freely), or zoom for the full image.
What is a graphical abstract?
A graphical abstract is a single, self-contained visual that summarizes the main finding of a research paper. It sits next to the written abstract in the journal's table of contents and on article pages, letting readers grasp the core message in a few seconds — before they decide to read further.
Most graphical abstracts read left to right or top to bottom as one clear flow: the question or input on one side, the method in the middle, and the key result at the end. Publishers such as Elsevier and Cell Press treat it as a first-class part of the submission, with their own size and content rules.
Key facts
- Elsevier asks for at least 1328 × 531 pixels at 300 dpi, in TIFF, EPS, PDF or an MS Office file.
- It is displayed small — around 500 × 200 px on ScienceDirect — so anything that only works at full size will not survive.
- It summarises one finding, not the whole paper: a graphical abstract with four messages has none.
- Publishers use different names for the same thing — ACS calls it a TOC graphic, clinical journals call it a visual abstract.
- It is submitted as a separate file, not embedded in the manuscript, and it is not counted as one of the paper’s figures.
How does the graphical abstract maker work?
Paste or upload
Drop in your abstract text or upload the full paper PDF — the tool reads it directly in your browser, no manual retyping.
Pick a style and size
Choose a visual style, the aspect ratio your journal wants and a resolution up to 4K. The credit cost for the selected model shows next to the generate button.
AI extracts the story
A language model identifies your key stages and findings, then renders them as a single visual flow with your labels reproduced exactly as written.
Polish and export
The abstract opens in your workspace: edit text, redraw regions, recolor, adjust the aspect ratio and export in high resolution for submission.
What makes a good graphical abstract
One message, not the whole paper
Pick the single most important finding and cut everything that doesn't support it. A graphical abstract that tries to retell every experiment reads like a wall of noise.
A clear visual flow
Arrange elements so the eye travels one way — left to right or top to bottom. Arrows and numbered stages beat scattered panels.
Legible at thumbnail size
Journals display graphical abstracts as small images. Use large sans-serif labels, few words, and shapes that survive being shrunk to 200 pixels tall.
Consistent scientific style
Stick to accurate structures, one color palette and one illustration style. Mixed clip-art styles are the fastest way to look unprofessional — and to get flagged by reviewers.
How to make a graphical abstract in 5 steps
- 1
Write the one-sentence takeaway
Before touching any design tool, finish this sentence: “Our paper shows that ___.” That sentence is your graphical abstract; everything visual serves it.
- 2
Sketch the flow
Block out 3–5 stages on paper: input → method → result. Decide the reading direction now — it's the hardest thing to change later.
- 3
Draft the visual
Describe your sketch to the graphical abstract maker, or build it from your figures. Keep molecular structures, pathways and anatomy scientifically accurate.
- 4
Cut and enlarge
Delete every label that isn't essential, then enlarge what's left. If a word doesn't survive thumbnail size, it doesn't belong.
- 5
Export to your journal's spec
Match the exact pixel dimensions and file format from the table above, and check the result at 100% zoom before uploading.
Graphical abstract templates and styles
A graphical abstract template in PowerPoint or Canva gives you an empty canvas and a font choice; you still do the thinking and the pasting. These styles work the other way round — each one is a rendering language the AI applies to your content, so the layout comes out of your paper rather than out of a grid you have to fill.
Flat vector
Clean shapes, solid fills and heavy sans-serif labels. The safest choice for Elsevier and MDPI submissions, and the style that survives being shrunk to a 200-pixel table-of-contents thumbnail.
Modern gradient
Soft gradients and depth cues for computational, materials and engineering work, where a flat diagram can look thinner than the research behind it.
Hand-drawn sketch
Ink-line illustration with a lab-notebook feel. Suits biology, ecology and methods papers, and reads as approachable on social media and in review articles.
Leave the style on auto and the model picks the look from your subject matter. Switching styles later keeps your text and flow intact — only the visual language changes.
Graphical abstract size requirements by journal
Every publisher sets its own specs. These are the current requirements from four major publisher families, checked against their author guidelines (August 2026):
| Publisher | Required size | File formats | Pick here | Notes |
|---|---|---|---|---|
| Elsevier | 1328 × 531 px minimum (w × h), 300 dpi | TIFF, EPS, PDF, MS Office | 21:9, 2K or 4K | Displayed at 500 × 200 px on ScienceDirect — keep labels large. |
| Cell Press | 1200 × 1200 px square, 300 dpi | TIFF, JPEG, PDF | 1:1, 2K or 4K | Must show the new findings of the paper; Arial 12–16 pt. |
| ACS journals | 3.25 × 1.75 in (~8.25 × 4.45 cm), 300 dpi | TIFF, EPS, high-res JPEG | 16:9, 2K | Called a “TOC graphic”; simple and readable beats detailed. |
| MDPI | 560 × 1100 px minimum (h × w) | PNG, JPEG, TIFF | 21:9 or 16:9, 2K | Maximum 2800 × 5500 px; avoid large text blocks. |
| Social media and slides | No fixed spec | PNG, JPEG | 16:9 or 1:1, 1K | No publisher spec — size it for the feed it will be posted to. |
Specs change and individual journals add their own rules — always confirm in the journal's guide for authors before submitting.
Graphical abstract examples made with this tool
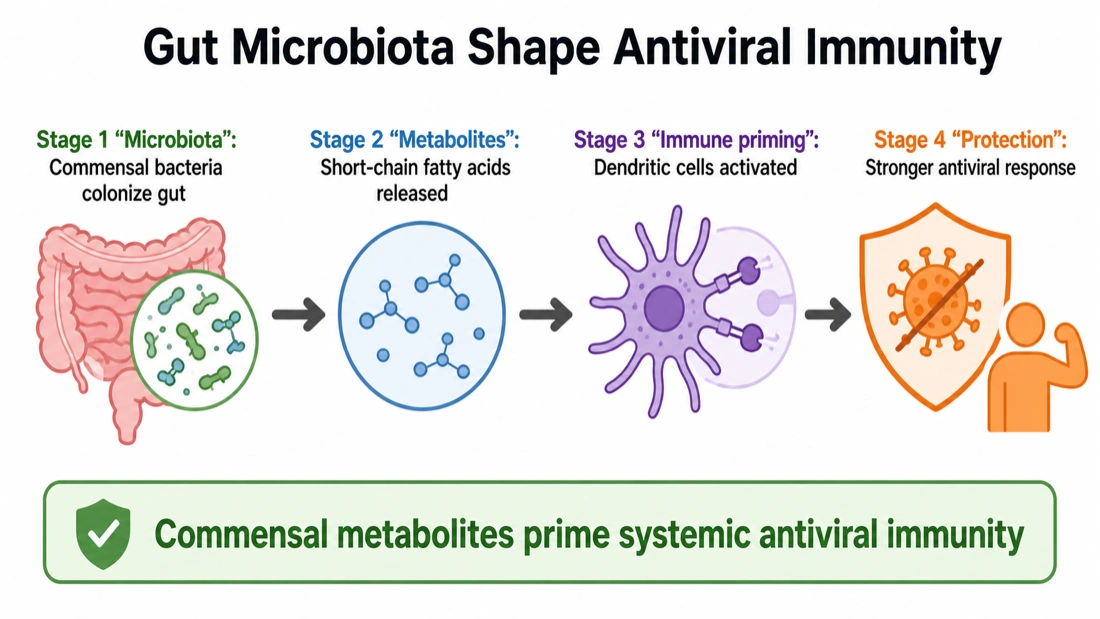
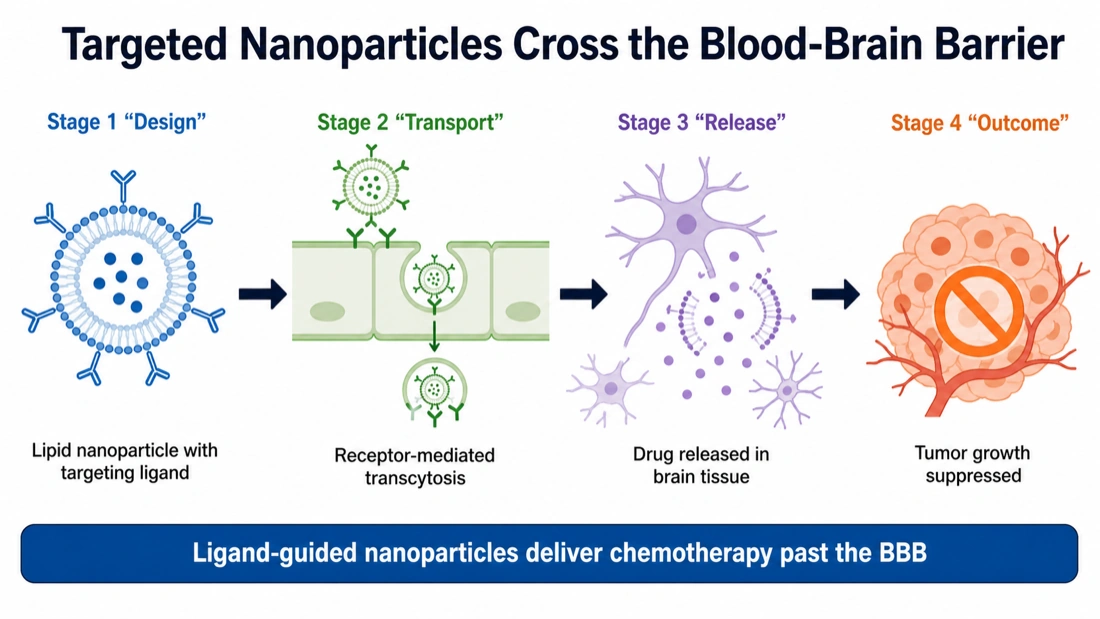
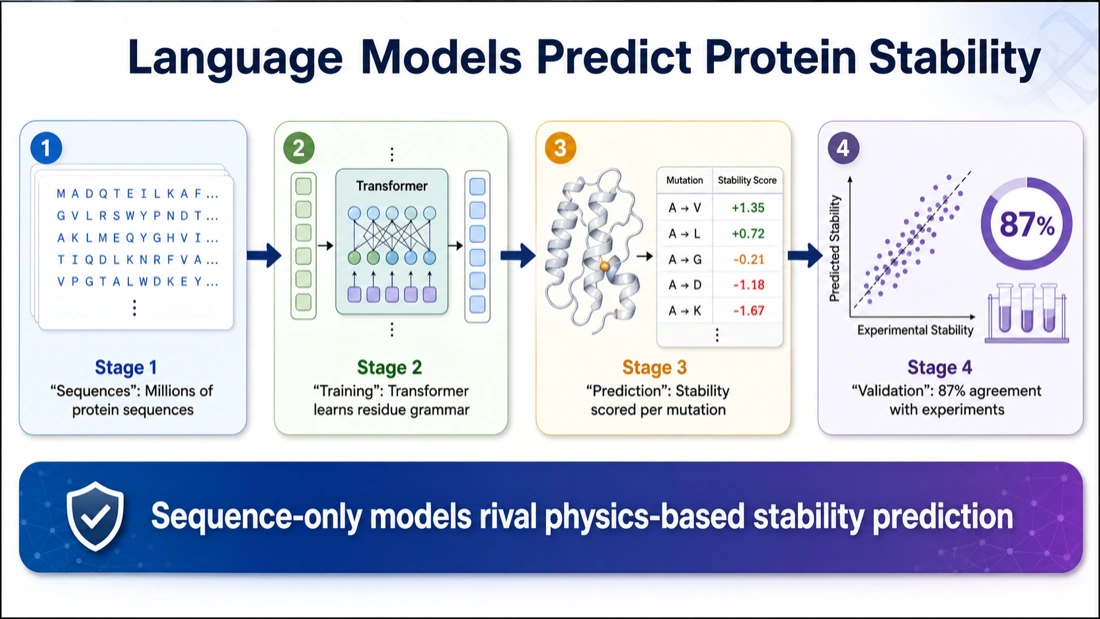
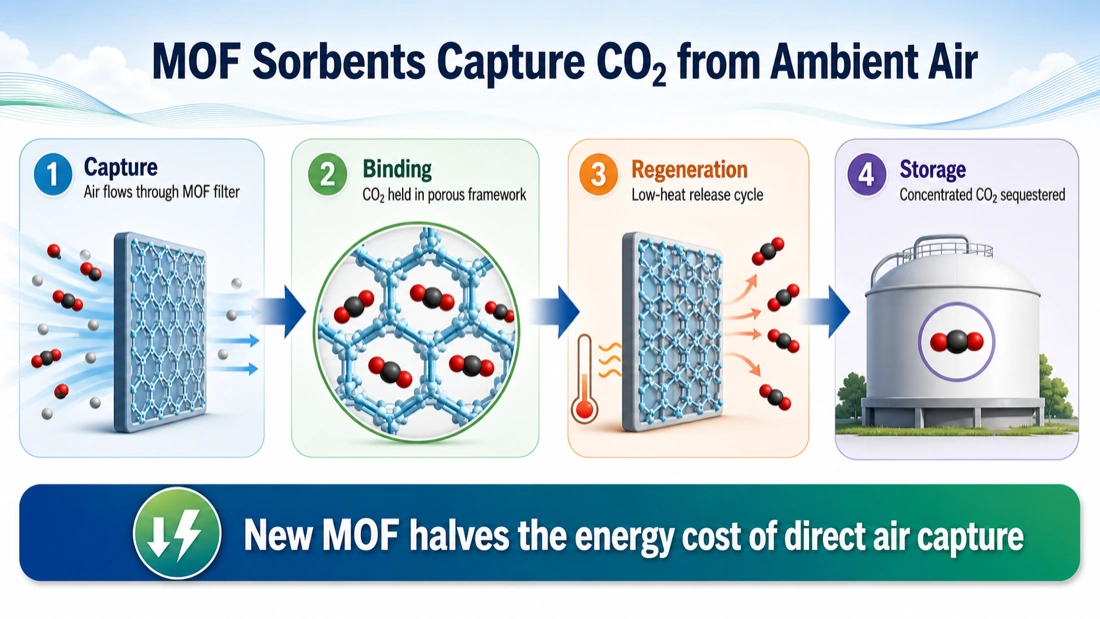
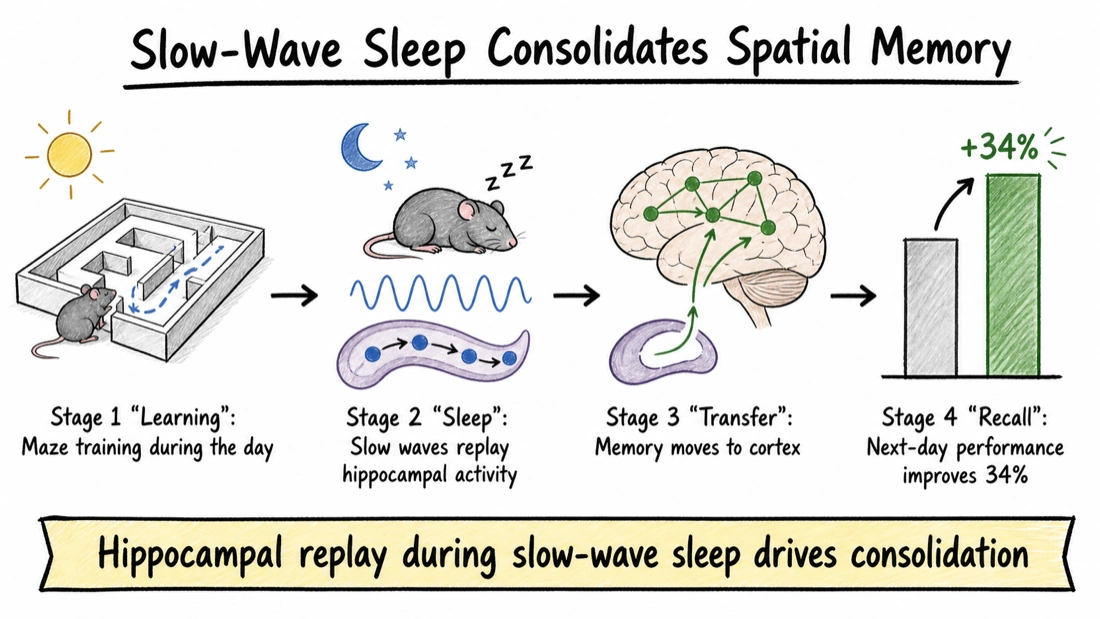
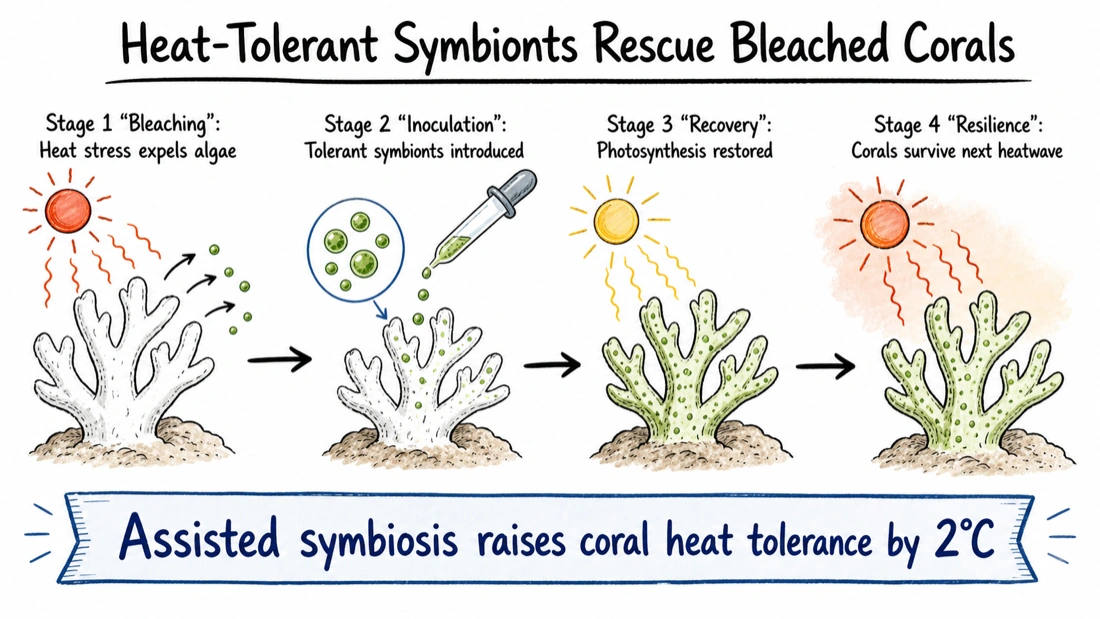
Six real outputs across microbiology, drug delivery, structural biology, climate, neuroscience and marine ecology — each one a single flow with one message.
Compared with BioRender, Illustrator and PowerPoint
Every route to a graphical abstract trades time against control. Here is where this tool sits against the software researchers usually reach for.
| This maker | BioRender / Illustrator | PowerPoint / Canva | |
|---|---|---|---|
| Starting point | Your abstract text or paper PDF | Blank canvas plus an icon library | A template you fill in yourself |
| Time to first draft | About two minutes | An afternoon, longer without practice | An evening of aligning boxes |
| Who writes the labels | Extracted from your own wording | You type each one | You type each one |
| Changing it afterwards | Quick edits, region redraw, recolor and version history | Full manual control over every object | Full manual control, no scientific assets |
| Journal sizing | Aspect presets and export up to 4K | Manual artboard setup and export | Manual resize, watch the resolution |
| Cost | Free credits at signup, then credits per generation | Subscription, free tier watermarked | Software you likely already own |
Illustrator and BioRender still win when you need to place every molecule by hand. This tool wins when the paper is finished, the deadline is not, and the figure has to exist tonight.
Graphical abstract or visual abstract?
The two terms describe the same job with different conventions. "Graphical abstract" is publisher language — Elsevier, Cell Press and ACS all use it, and it usually means one continuous flow from question to finding. "Visual abstract" is the clinical term, popularized by journals such as JAMA, Annals of Surgery and BMJ, and it usually follows a fixed three-panel structure: population, intervention, outcome, with the effect size stated in numbers.
This tool makes both. For a visual abstract, paste your clinical abstract, add an instruction such as "three panels: population, intervention, outcome, with the primary endpoint as a number" and choose a 1:1 or 4:3 ratio. The extraction step keeps your reported values intact rather than rounding or inventing them.
Visual abstract maker →What a graphical abstract is not
A graphical abstract is not a figure lifted from the paper, and it is not an infographic. A figure answers a question for a reader who has already committed; a graphical abstract has to earn that commitment in a few seconds, from a table of contents, against everything else on the page. That is a different brief, and it is why reusing Figure 1 rarely works.
| Graphical abstract | Figure from the paper | Infographic | |
|---|---|---|---|
| Job | Make someone open the paper | Present evidence to a reader already reading | Explain a topic to a general audience |
| Where it appears | Table of contents, article page, social posts | Inside the results section | Blogs, press, social media |
| How long it gets | A few seconds | Minutes, re-read as needed | Under a minute |
| Number of messages | One | One per panel, several panels | Several, in sequence |
| Amount of text | A handful of short labels | Full caption plus axis labels | Substantial, often narrative |
| Data shown | Usually simplified or schematic | Exact, with error bars and statistics | Selected highlights |
| Peer reviewed | Usually not | Yes | No |
| Submitted as | A separate file | Part of the manuscript | Not part of submission |
A schematic in a graphical abstract does not have to carry error bars — it has to be true. Simplifying is allowed; overstating what the data support is not.
Common questions about graphical abstracts
What size should a graphical abstract be?
It depends on the journal: Elsevier asks for at least 1328 × 531 pixels, Cell Press wants a 1200-pixel square, ACS uses 3.25 × 1.75 inches, and MDPI requires at least 560 × 1100 pixels. Always check your journal's guide for authors.
Do all journals require a graphical abstract?
No. Some journals require one (many Cell Press and MDPI titles), many make it optional, and some don't display them at all. Optional or not, papers with a clear graphical abstract tend to get more visibility in tables of contents and on social media.
How much text should a graphical abstract contain?
As little as possible — short labels, not sentences. A good test: if your graphical abstract still makes sense when scaled to 200 pixels tall, the text amount is right.
What's the difference between a graphical abstract and a visual abstract?
They're largely the same thing — “visual abstract” is more common in medicine and often uses a standardized three-panel layout, while “graphical abstract” is the term publishers like Elsevier and Cell Press use. Both summarize one paper in one image.
What software can I use to make a graphical abstract?
Researchers use Illustrator, PowerPoint, BioRender or dedicated AI tools. Scientific Figure's graphical abstract maker generates a journal-ready draft from a text description of your study, keeps every element editable, and exports at publisher-specific sizes.
Can I use AI to make a graphical abstract for a journal?
Publishers distinguish between general-purpose image generators and dedicated scientific illustration tools. Cell Press, for example, prohibits general-purpose generative AI for graphical abstracts while allowing dedicated tools. Check your target journal's policy, disclose AI assistance where required, and take responsibility for the scientific accuracy of every element.
Is this graphical abstract maker free?
New accounts get free credits at signup, which is enough to make your first graphical abstracts. After that each generation costs credits, and the exact number depends on the model and resolution you choose — it is shown next to the generate button before you spend anything. Failed generations are refunded automatically.
Can I make a graphical abstract online without installing software?
Yes. Everything runs in the browser, including PDF reading, generation and editing. There is nothing to download and no design software to learn, which is the point for researchers who need one figure rather than a design career.
Will it use my actual wording?
Yes. The AI extracts stage labels and the key finding from your text and instructs the image model to render them exactly as written — nothing is invented. Proofread the rendered labels anyway, the way you would proofread any figure before submission.
Is there a graphical abstract template for PowerPoint or Canva?
There are plenty online, and they all leave you with an empty canvas to fill. This tool takes the opposite route: pick one of three visual styles and the AI lays your own content into it. You can still export the result and drop it into a slide deck or a Canva design afterwards.
What if the result isn't quite right?
Every generation lands in your workspace with full editing: quick edits, region redraw, recoloring and version history — the original is always one click away. You can also regenerate with added instructions about what to emphasize or reorder.
How do you make a graphical abstract?
Start from the one sentence you would want a reader to take away, then draw only what that sentence needs. Usually that is three beats laid left to right: what was studied, what was done to it, what changed. Add short labels rather than sentences, keep to two or three colours, and check it at the size the journal actually displays it — around 500 × 200 px for Elsevier. Here, pasting your abstract produces that layout directly.
Can I reuse a figure from my paper as the graphical abstract?
You can, and most journals will accept it, but it usually underperforms. A results figure is built for a reader who has already decided to read the paper: it carries axes, error bars, statistics and a caption that explains it. A graphical abstract has a few seconds and no caption. If you do reuse one, strip it back — remove statistical annotation, enlarge the labels, and add the one-line finding the figure supports.
Keep exploring
Our other diagram tools, and the guides behind them.

Make your graphical abstract now
From abstract to journal-ready visual in a couple of minutes.
Create graphical abstract