
Nitrogen Cycle Diagram Maker
Describe the diagram you need and get a labeled nitrogen cycle — nitrogen fixation, ammonification, nitrification, assimilation and denitrification, each arrow named for its process. Or view the labeled and blank versions below, free.
Or start from an example
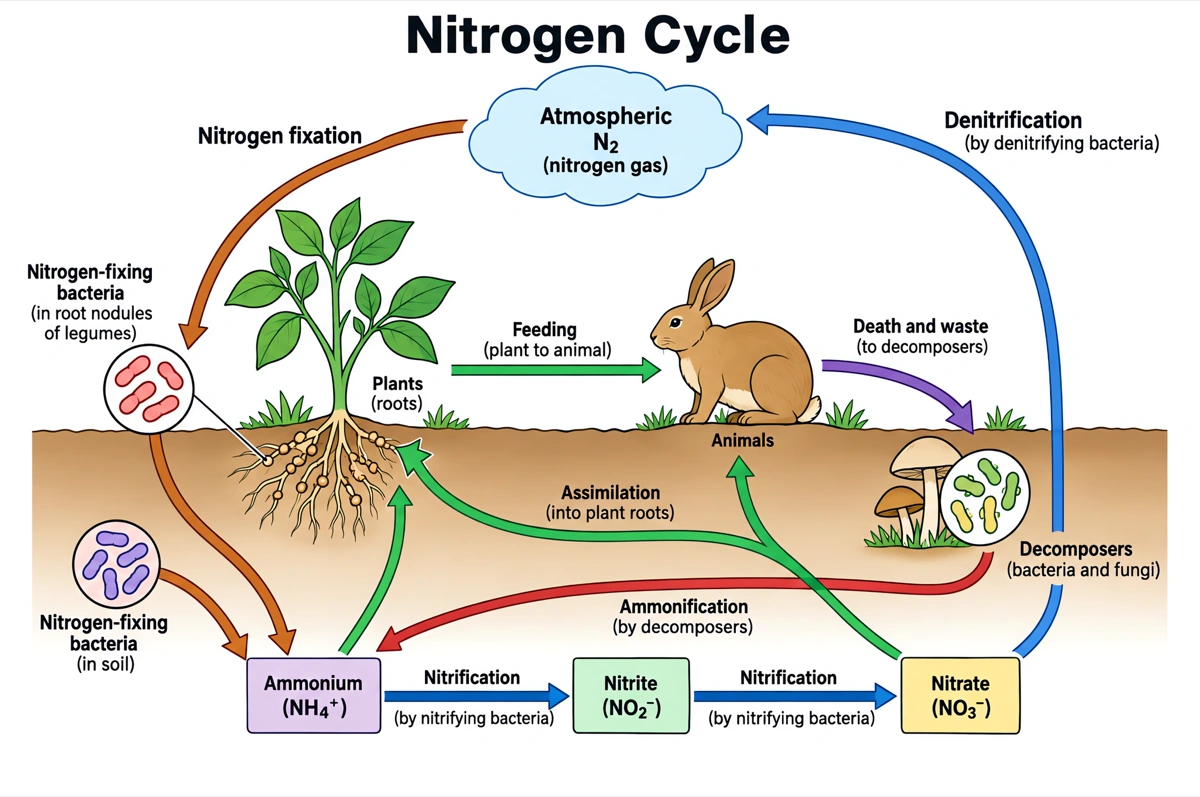
Labeled nitrogen cycle diagram (answer key)
Nitrogen gas, ammonium, nitrite and nitrate, with every arrow named for its process. Print it as the answer key, or hand it out as a revision sheet.
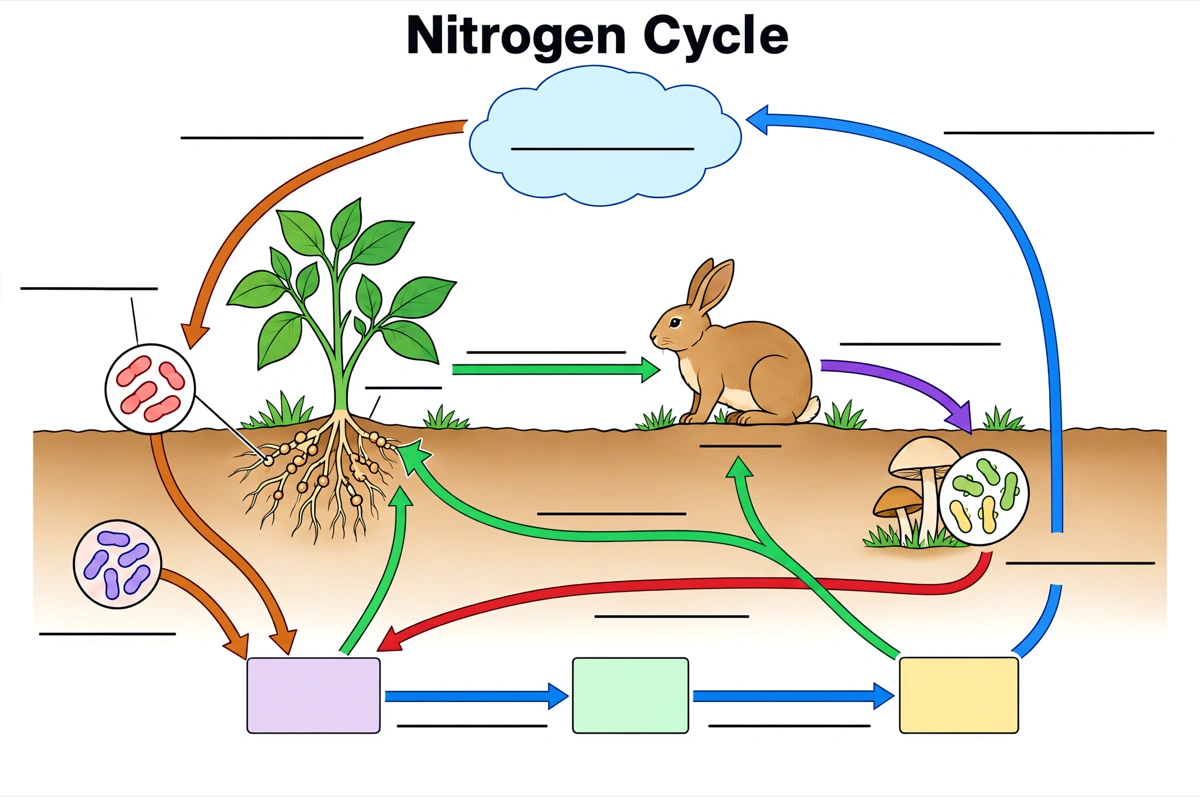
Blank nitrogen cycle diagram to label
The same drawing with an empty answer line where every label was, ready for a worksheet, a quiz or an exam question.
What is a nitrogen cycle diagram?
A nitrogen cycle diagram shows how nitrogen moves between the air, the soil and living things: bacteria fix nitrogen gas into ammonium, nitrifying bacteria turn it into nitrate, plants absorb it, and denitrifying bacteria return it to the air. Each arrow names its process.
Key facts
- Nitrogen gas makes up about 78 percent of the atmosphere, but plants cannot use it. The two atoms in N₂ are held by a triple bond, so the gas must first be fixed into ammonia or ammonium before plants and phytoplankton can take it up.
- Nitrogen fixation is done mostly by bacteria. Rhizobium lives in the root nodules of legumes such as peas, beans and clover; cyanobacteria and free-living soil bacteria such as Azotobacter fix nitrogen too, and lightning fixes a little with no organism involved.
- Nitrification takes two groups of microbes. Ammonia-oxidizers such as Nitrosomonas turn ammonium into nitrite; a separate group, nitrite-oxidizers such as Nitrobacter, turn nitrite into nitrate. Both steps need oxygen.
- Denitrification closes the loop. In waterlogged soil, sediments and other low-oxygen places, bacteria such as Pseudomonas reduce nitrate back to nitrogen gas, releasing some nitrous oxide (N₂O), a greenhouse gas, along the way.
- Human activity has doubled global nitrogen fixation. Fertilizer made by the Haber-Bosch process and the burning of fossil fuels add fixed nitrogen on the scale of all natural sources; runoff of the excess causes eutrophication in lakes, rivers and coastal seas.
How does the nitrogen cycle diagram maker work?
Describe the diagram
Say what it is for and how deep it should go — a full labeled cycle, a simple overview, a close-up of the soil and the root nodules. A sentence is enough.
Pick a style
The default is a clean flat textbook plate — white background, labels on straight leader lines. Or apply watercolor, ink line art, 3D and other finishes.
Refine and export
The result opens in your workspace, where you can redraw regions, edit labels on the canvas, upscale and export in high resolution.
Processes of the nitrogen cycle and what each one does
The processes a labeled nitrogen cycle diagram is normally expected to name on its arrows, what each one does, and which organisms carry it out. This is the default label set unless you ask for a shorter one.
| Process | What happens | Carried out by |
|---|---|---|
| Nitrogen fixation | Nitrogen gas (N₂) is converted into ammonia (NH₃) or ammonium (NH₄⁺) | Rhizobium in legume root nodules, cyanobacteria, free-living soil bacteria such as Azotobacter |
| Lightning fixation | The energy of a lightning strike fixes a small amount of atmospheric nitrogen | No organism — an abiotic process |
| Industrial fixation | Nitrogen and hydrogen react to make ammonia for fertilizer (the Haber-Bosch process) | Fertilizer plants |
| Assimilation | Plants take up ammonium and nitrate through their roots and build them into proteins and nucleic acids | Plants, then the animals that eat them |
| Ammonification | Decomposers break down dead organisms and animal waste, releasing ammonium | Bacteria and fungi |
| Nitrification, step 1 | Ammonium is oxidized to nitrite (NO₂⁻) | Ammonia-oxidizing bacteria such as Nitrosomonas, and ammonia-oxidizing archaea |
| Nitrification, step 2 | Nitrite is oxidized to nitrate (NO₃⁻) | Nitrite-oxidizing bacteria such as Nitrobacter |
| Denitrification | Nitrate is reduced step by step to nitrogen gas, which returns to the atmosphere | Bacteria such as Pseudomonas and Clostridium, in low-oxygen soil and water |
| Anammox | Ammonium and nitrite react to form nitrogen gas without oxygen | Planctomycetes bacteria in low-oxygen water and sediments |
Courses differ in how many of these they expect. Introductory worksheets often stop at fixation, nitrification, assimilation and denitrification; ecology and microbiology courses add ammonification, the two steps of nitrification, anammox and industrial fixation. Name the labels you need and only those are drawn.
Nitrification vs denitrification: what is the difference?
Nitrification turns ammonium into nitrate, keeping nitrogen in the soil in a form plants can absorb; denitrification turns nitrate into nitrogen gas, removing it from the soil and returning it to the air. Nitrification needs oxygen; denitrification happens where oxygen is scarce.
| Nitrification | Denitrification | |
|---|---|---|
| What it converts | Ammonium (NH₄⁺) → nitrite (NO₂⁻) → nitrate (NO₃⁻) | Nitrate (NO₃⁻) → nitrite and gaseous oxides → nitrogen gas (N₂) |
| Oxygen | Needs oxygen (aerobic) | Happens without oxygen (anaerobic) |
| Where it happens | Well-aerated soil and water | Waterlogged soil, sediments, low-oxygen zones of lakes and oceans |
| Microbes | Nitrosomonas, then Nitrobacter | Pseudomonas, Paracoccus, Bacillus and others |
| Energy for the microbes | Oxidizing ammonium or nitrite — very little, so they grow slowly | Breaking down organic carbon, with nitrate in place of oxygen |
| Effect on the soil | Keeps nitrogen in the soil, as nitrate that plants absorb | Removes nitrogen from the soil |
| Side effect to watch | Nitrate washing into streams and drinking water | Nitrous oxide (N₂O), a greenhouse gas |
Draw nitrification as two arrows, ammonium to nitrite and nitrite to nitrate, and denitrification as one arrow from nitrate back to the atmosphere. A diagram that labels the arrow from nitrate to the air as nitrification, or joins ammonium straight to nitrate with no nitrite step, is the error to check for first.
Where are nitrogen cycle diagrams used?
Nitrogen cycle diagrams are used mostly in biology, ecology and environmental science teaching — labeling worksheets, exam revision and lesson slides — and in farming, soil science and water-quality work. What changes is the depth: bacteria, plants and decomposers for a first course, every chemical form and the microbe behind each step for a university one.
School biology and ecology
Labeling worksheets and revision sheets from middle school life science through GCSE, A-level, AP Environmental Science and IB. Usually the labeled cycle, plus the same drawing blank for students to fill in.
University ecology and microbiology
Lectures on biogeochemical cycles and soil microbes: the nitrogenase enzyme, ammonia-oxidizing archaea, anammox, and why nitrogen so often limits plant growth.
Farming and soil science
Course slides and extension sheets on legumes in crop rotation, fertilizer timing and nitrate loss — where the cycle explains why a crop of peas or clover leaves nitrogen in the soil.
Water quality and environment
Panels on fertilizer runoff, eutrophication and wastewater treatment, where nitrifying and denitrifying bacteria are put to work removing ammonium and nitrate.
Common questions about nitrogen cycle diagrams
What should a labeled nitrogen cycle diagram include?
The standard set is nitrogen gas in the atmosphere, nitrogen-fixing bacteria in root nodules and in the soil, ammonium, nitrite and nitrate, plants, animals and decomposers, joined by arrows labeled nitrogen fixation, assimilation, ammonification, nitrification and denitrification. That is the default — ask for fewer labels and only those are drawn.
Can I get a blank nitrogen cycle diagram for students to label?
Yes — view the blank version on this page free, or ask for one and every label is replaced by an empty answer line. The labeled version is the matching answer key, so the two print as a pair.
What are the steps of the nitrogen cycle in order?
Nitrogen fixation, nitrification, assimilation, ammonification and denitrification. Bacteria fix N₂ into ammonium; nitrifying bacteria turn ammonium into nitrite and then nitrate; plants absorb nitrate and ammonium and animals eat the plants; decomposers return the nitrogen in waste and dead tissue as ammonium; denitrifying bacteria turn nitrate back into N₂. Nitrogen can pass between the soil and living things many times before it returns to the air.
Why can't plants use nitrogen from the air?
Because the two atoms in N₂ are held by a triple bond that plants have no enzyme to break. Only certain bacteria and archaea carry nitrogenase, the enzyme that reduces N₂ to ammonia, and the reaction costs at least 16 ATP for every molecule of N₂ fixed.
What do the bacteria in legume root nodules do?
They fix nitrogen for the plant. Rhizobium bacteria are drawn to the roots of legumes such as peas, beans, soybeans and clover, enter them and form nodules, where they turn nitrogen gas into a form the plant can use. That is why gardeners and farmers grow peas and clover partly to add nitrogen to the soil.
Is nitrogen fixation the same as nitrification?
No — nitrogen fixation turns nitrogen gas into ammonia or ammonium; nitrification turns ammonium into nitrite and then nitrate. Fixation brings nitrogen into the living world from the air; nitrification changes its form once it is already in the soil. Different microbes do each: Rhizobium and Azotobacter fix, Nitrosomonas and Nitrobacter nitrify.
What is ammonification?
Ammonification is the release of ammonium by decomposers. When an organism dies or excretes waste, the nitrogen in its proteins and nucleic acids is organic; bacteria and fungi break it down and release it as ammonia or ammonium, which plants can take up or nitrifying bacteria can oxidize.
How do humans affect the nitrogen cycle?
Mainly through fertilizer and the burning of fossil fuels, which together have doubled the amount of nitrogen fixed each year. Unused fertilizer nitrate washes into rivers and lakes and causes eutrophication — overgrowth that uses up the dissolved oxygen — while nitrogen oxides from combustion add to acid rain and nitrous oxide to climate change.
Can I make a simple nitrogen cycle drawing for younger students?
Yes — ask for a simple overview and the diagram drops to the essentials: nitrogen in the air, bacteria fixing it in the soil, plants and animals using it, and decomposers returning it. Five labels or fewer usually covers a middle-school class.
How is this different from a generic AI image tool?
The subject brief is built in. Every render is instructed to follow the standard textbook drawing — each stage in its true order around a closed loop, joined by arrows that name the process — with each label spelled exactly. Check the labels against your course before printing; the canvas lets you correct any in place.
Can I use the diagrams for school, teaching or publication?
Yes — diagrams you generate are yours to use in worksheets, presentations, handouts, theses and papers. Export high-resolution raster up to 4K depending on the model.
Can I change the labels after generating?
Yes. The result opens in a canvas workspace that recognizes the diagram labels — you can edit or translate the text, move leader lines, redraw a region or recolor without regenerating the whole figure.
Sources
- Biogeochemical Cycles — Biology 2e, section 46.3 — OpenStax
- The Nitrogen Cycle: Processes, Players, and Human Impact — Nature Education (Scitable)
Keep exploring
Our other diagram tools, and the guides behind them.

Draw your nitrogen cycle diagram
From a one-line description to a labeled, printable diagram in about a minute.
Start drawing