
Action Potential Graph Maker
Describe the graph you need and get a labeled action potential — resting potential, threshold, depolarization, peak, repolarization and hyperpolarization, with the Na⁺ and K⁺ channel events and the refractory periods. Or view the labeled and blank versions below, free.
Action potential graph examples
Real renders of the prompts shown: a fully labeled neuron action potential, a five-label school version, a cardiac action potential with phases 0–4 and a blank worksheet. Click one to load and edit its prompt.
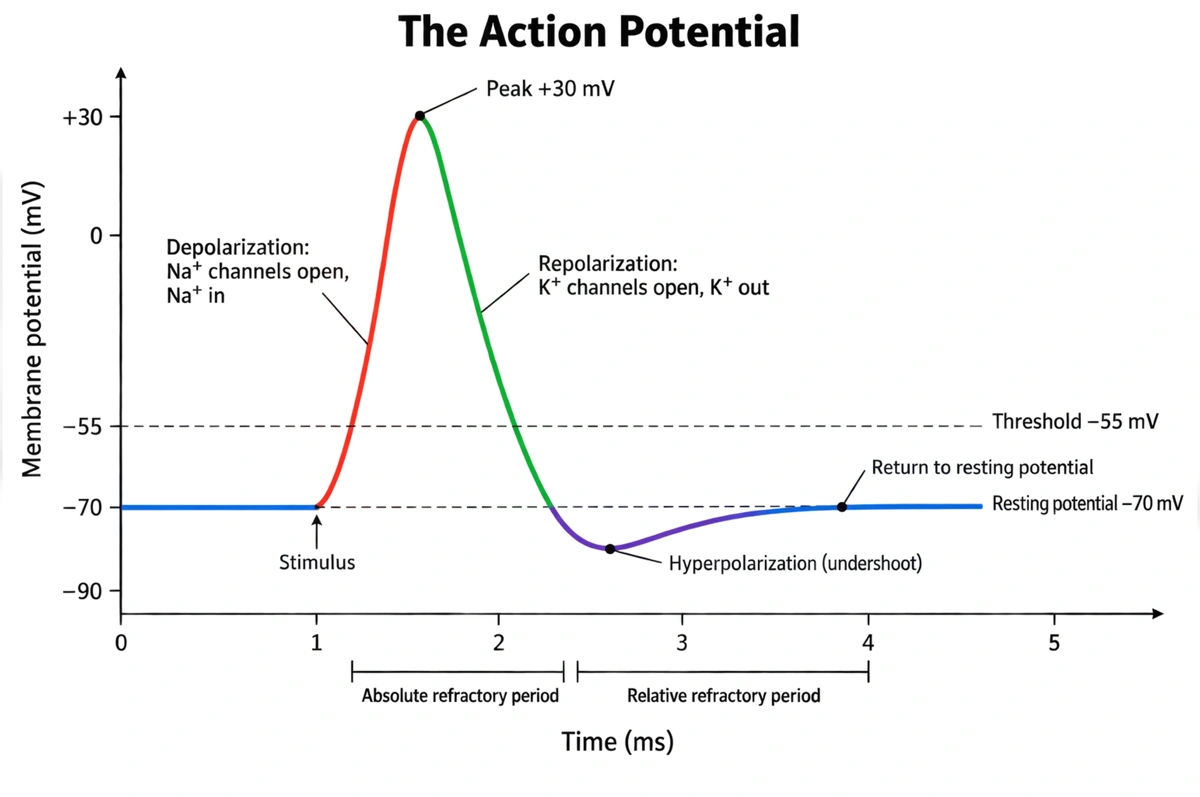
Labeled action potential graph (answer key)
Every phase of the spike named on the curve, from the resting potential through threshold, depolarization and repolarization to the undershoot. Print it as the answer key, or hand it out as a revision sheet.
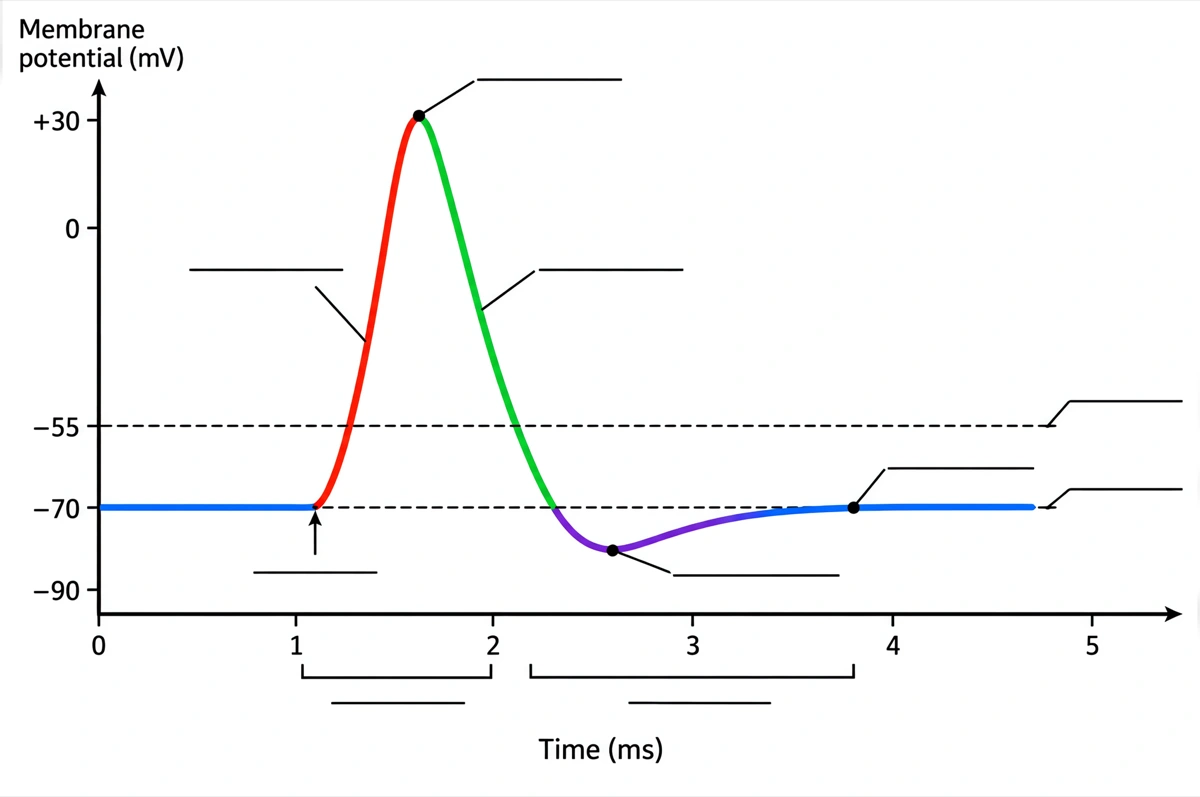
Blank action potential graph to label
The same graph with an empty answer line where every label was, ready for a worksheet, a quiz or an exam question.
What is an action potential graph?
An action potential graph plots a neuron's membrane potential in millivolts against time in milliseconds: from a resting potential of about −70 mV the membrane depolarizes past a threshold of about −55 mV, spikes to about +30 mV, repolarizes, dips briefly below rest and returns to −70 mV. Each phase is labeled with the ion channels that drive it.
Key facts
- The whole spike lasts about 1 to 2 milliseconds in a neuron. The membrane potential swings about 100 mV, from −70 mV at rest to about +30 mV at the peak, and is back at rest a few milliseconds later.
- Voltage-gated Na⁺ channels drive depolarization. Once a stimulus brings the membrane to about −55 mV they open, Na⁺ rushes in and the rise feeds itself — a positive-feedback loop that makes the upstroke almost vertical.
- Voltage-gated K⁺ channels drive repolarization. They open more slowly than the Na⁺ channels, about when the Na⁺ channels inactivate at the peak, so K⁺ flows out and the membrane potential falls back.
- The undershoot comes from K⁺ channels that close late. Potassium keeps leaving for a moment after rest is reached, pulling the membrane below −70 mV toward the K⁺ equilibrium potential of about −90 mV before the Na⁺/K⁺ pump and leak channels restore rest.
- Action potentials are all-or-none. A stimulus that does not reach threshold produces no spike, and every stimulus that does produces the same spike to the same peak; a stronger stimulus fires more spikes per second, not bigger ones.
How does the action potential graph maker work?
Describe the graph
Say what it is for and how much it should show — a fully labeled neuron action potential with its ion channels, a simple five-label version, a cardiac action potential with phases 0 to 4. A sentence is enough.
Pick a style
The default is a clean textbook graph — white background, labeled axes with units, dashed reference lines and labels on straight leader lines. Or apply ink line art, watercolor and other finishes.
Refine and export
The result opens in your workspace, where you can redraw regions, edit labels on the canvas, upscale and export in high resolution.
Phases of the action potential: ion channels and membrane potential
The phases a labeled action potential graph is normally expected to show, the ion channel event behind each one, and where it sits on the voltage axis. This is the default label set unless you ask for a shorter one.
| Phase | What the ion channels do | Membrane potential |
|---|---|---|
| Resting potential | Voltage-gated channels are closed; K⁺ leak channels and the Na⁺/K⁺ pump hold the membrane steady | About −70 mV |
| Stimulus | A graded potential, for example from a synapse, lets positive charge in and depolarizes the membrane | From −70 mV toward −55 mV |
| Threshold | Enough voltage-gated Na⁺ channels open for the rise to become self-sustaining | About −55 mV |
| Depolarization (rising phase) | Voltage-gated Na⁺ channels open fully and Na⁺ rushes into the cell | From −55 mV up through 0 mV |
| Peak (overshoot) | Na⁺ channels inactivate as the slower voltage-gated K⁺ channels open | About +30 mV |
| Repolarization (falling phase) | K⁺ flows out through the open voltage-gated K⁺ channels | From the peak back down toward −70 mV |
| Hyperpolarization (undershoot) | The K⁺ channels close late, so K⁺ keeps leaving for a moment | Briefly below −70 mV |
| Return to resting potential | The K⁺ channels close; leak channels and the Na⁺/K⁺ pump restore rest | Back to about −70 mV |
| Absolute refractory period | Na⁺ channels are open or inactivated, so no stimulus can start a second spike | From threshold through the peak and most of the fall |
| Relative refractory period | Some Na⁺ channels have reset but K⁺ is still leaving, so only a stronger stimulus works | The end of the fall and the undershoot |
Courses differ in how many phases they name. Introductory worksheets label the resting potential, threshold, depolarization, repolarization and hyperpolarization; A-level, AP and university courses add the stimulus, the peak, the channel events and both refractory periods, and some textbooks put the peak at +40 mV rather than +30 mV. Name the labels and values you need and only those are drawn.
Graded potential vs action potential: what is the difference?
A graded potential is a small, local change in membrane potential whose size follows the strength of the stimulus and fades with distance; an action potential is an all-or-none spike to about +30 mV that fires only at threshold and travels the length of the axon without shrinking. Graded potentials on the dendrites and cell body add up at the start of the axon, and an action potential fires there only if their sum reaches threshold.
| Graded potential | Action potential | |
|---|---|---|
| Size | Varies with the strength of the stimulus | Always the same, about 100 mV from rest to peak (all-or-none) |
| Direction | Depolarizing or hyperpolarizing | Always depolarizes, then repolarizes |
| Threshold | None — any stimulus produces one | Fires only when the membrane reaches about −55 mV |
| Over distance | Fades within a short distance of where it starts | Regenerated along the axon at full strength |
| Where it happens | Dendrites, cell body and sensory receptors | The axon, from its initial segment to the axon terminals |
| Summation and refractory period | Can add together; no refractory period | Cannot add together; followed by a refractory period |
On a graph, a graded potential is a small bump that stays below the threshold line, or a dip below rest; an action potential is the tall spike that crosses threshold, overshoots 0 mV and undershoots rest. If a drawing shows spikes of different heights for different stimuli, it is showing graded potentials, not action potentials.
Where are action potential graphs used?
Action potential graphs are used mostly in biology and physiology teaching — labeling worksheets, exam revision and lecture slides — and in nursing, medical and pharmacology courses that show how drugs and electrolytes change the curve. What changes is the depth: five phase names for a first course, every channel event and both refractory periods for a medical one.
School biology
Labeling worksheets and revision sheets for GCSE, A-level, AP Biology and IB, where the action potential is the core of the nerve impulse. Usually the labeled graph, plus the same graph blank for students to fill in.
Anatomy, physiology and nursing
A&P lectures and nursing courses that tie each phase to its ion — why a high or low blood potassium changes how excitable nerves and heart muscle are, and how the cardiac action potential lines up with the ECG.
Medicine and pharmacology
Slides that put each drug on the phase it changes: local anesthetics and class I antiarrhythmics blocking the Na⁺ channels of the upstroke, class III antiarrhythmics blocking K⁺ channels and lengthening repolarization.
Research and textbook figures
Schematic panels for electrophysiology papers, theses and textbook chapters — a clean reference trace beside recorded data, with the phases and reference levels marked.
Common questions about action potential graphs
What are the 5 phases of an action potential?
Most courses name five: the resting potential, threshold, depolarization, repolarization and hyperpolarization (the undershoot), after which the membrane returns to rest. Some count the stimulus or the peak as a phase instead of threshold. On the graph they run in that order from left to right, all within about 2 ms in a neuron.
What should a labeled action potential graph include?
Membrane potential (mV) on the vertical axis and time (ms) on the horizontal axis, dashed lines for the resting potential (−70 mV) and threshold (−55 mV), and the stimulus, depolarization, peak (+30 mV), repolarization, hyperpolarization and return to rest on one spike. A&P and medical courses add the Na⁺ and K⁺ channel events and the absolute and relative refractory periods. That is the default — ask for fewer labels and only those are drawn.
Can I get a blank action potential graph to label?
Yes — view the blank version on this page free, or ask for one and every phase name and value is replaced by an empty answer line. The axes and the curve stay, and the labeled graph is the matching answer key, so the two print as a pair.
Why does the membrane potential overshoot to +30 mV?
Because Na⁺ keeps flowing in after the inside of the membrane passes 0 mV, pushed by its steep concentration gradient. The membrane heads toward the Na⁺ equilibrium potential of about +60 mV, but the Na⁺ channels inactivate and the K⁺ channels open first, so the peak stops near +30 mV.
What is the refractory period?
The time after a spike when the membrane cannot fire again (absolute refractory period) or needs a stronger than normal stimulus to fire (relative refractory period). The absolute period lasts while the Na⁺ channels are open or inactivated; the relative period follows while K⁺ is still leaving. It keeps spikes separate and makes the impulse travel one way along the axon.
What happens during depolarization and repolarization?
In depolarization, voltage-gated Na⁺ channels open and Na⁺ rushes in, so the inside of the cell turns from −70 mV to about +30 mV; in repolarization, voltage-gated K⁺ channels open and K⁺ flows out, bringing it back down. Na⁺ moves in on the rising edge of the graph and K⁺ moves out on the falling edge.
What causes hyperpolarization after an action potential?
The voltage-gated K⁺ channels close a little late, so K⁺ keeps leaving the cell after the membrane is back at −70 mV. The potential dips below rest toward the K⁺ equilibrium potential, then the channels close and leak channels and the Na⁺/K⁺ pump return it to −70 mV.
What is the threshold potential?
The membrane potential, about −55 mV in a typical neuron, at which enough voltage-gated Na⁺ channels open for depolarization to keep itself going. Below it, a stimulus fades as a graded potential; at or above it, a full action potential fires — the all-or-none rule.
What is the difference between a neuron and a cardiac action potential?
A ventricular muscle action potential lasts about 250 to 300 ms instead of about 2 ms, starts from about −90 mV instead of −70 mV and has a long plateau (phase 2) while Ca²⁺ enters through slow channels. The plateau gives heart muscle a refractory period of about 250 ms, so it cannot be re-excited before it has contracted.
How is this different from a generic AI image tool?
The subject brief is built in. Every render is instructed to draw the standard textbook graph — labeled axes with units, the curve in its true shape with no extra peaks, dashed reference levels and each phase called out once on a straight leader line, spelled exactly. Check the values against your course before printing; the canvas lets you correct any in place.
Can I use the graphs for school, teaching or publication?
Yes — graphs you generate are yours to use in worksheets, presentations, handouts, theses and papers. Export high-resolution raster up to 4K depending on the model.
Can I change the labels after generating?
Yes. The result opens in a canvas workspace that recognizes the graph labels — you can edit or translate the text, change a value, move leader lines or redraw a region without regenerating the whole figure.
Keep exploring
Our other diagram tools, and the guides behind them.

Draw your action potential graph
From a one-line description to a labeled, printable graph in about a minute.
Start drawing