
Cellular Respiration Diagram Generator
Describe the diagram you need and get the full pathway — glycolysis in the cytosol, the Krebs cycle in the matrix, the electron transport chain on the inner membrane — labelled and ready for class or a figure.
Cellular respiration diagram examples
Real renders of four cellular respiration prompts: all three stages with their ATP, a simple overview, respiration beside photosynthesis and the electron transport chain. Click one to load its prompt and edit it.
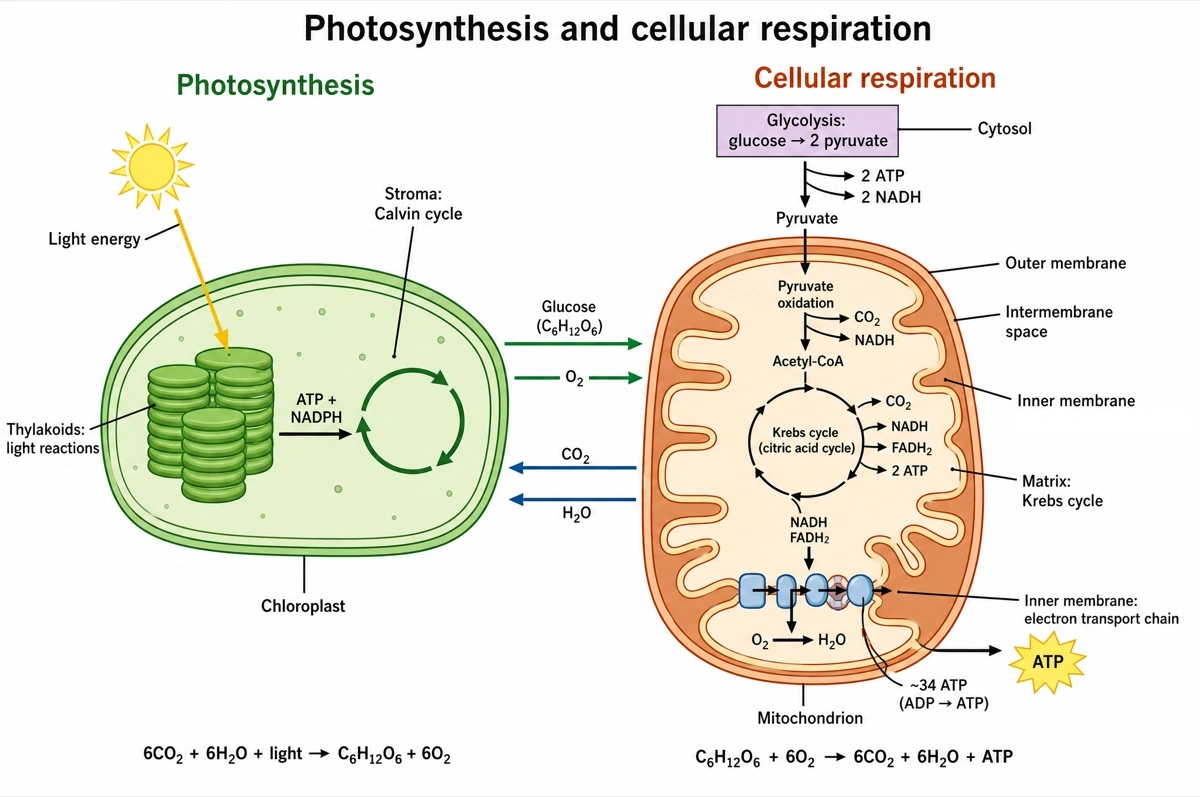
Photosynthesis and cellular respiration diagram
Each process's products are the other's reactants.
- 1
Mirror-image equations
CO₂ + H₂O → glucose + O₂, and glucose + O₂ → CO₂ + H₂O.
- 2
Chloroplast vs mitochondrion
Chloroplasts make glucose; mitochondria break it down.
- 3
Energy stored vs released
Light energy is stored in glucose, released as ATP.
What is a cellular respiration diagram?
A cellular respiration diagram is a labelled figure showing how a cell converts glucose and oxygen into ATP across three stages — glycolysis, the Krebs cycle and the electron transport chain — with each stage placed in the compartment where it actually occurs. Most versions also mark the ATP, NADH and FADH2 produced at each step, so the energy arithmetic can be followed across the whole pathway.
Key facts
- Three stages, three locations. Glycolysis runs in the cytosol; pyruvate oxidation and the Krebs cycle in the mitochondrial matrix; the electron transport chain on the inner mitochondrial membrane.
- Overall equation. One glucose plus 6 O2 yields 6 CO2, 6 H2O and roughly 30–32 ATP.
- Electron carriers do the work. NADH and FADH2 carry electrons from the first two stages to the chain, where oxygen is the final electron acceptor.
- Common variants. An overview plate, a stage-by-stage breakdown, the electron transport chain complex by complex, or respiration paired with photosynthesis.
- Typical uses. GCSE, AP, IB and undergraduate biology worksheets, lecture slides, revision handouts and textbook-style figures.
What is the equation for cellular respiration?
The overall equation for cellular respiration is C6H12O6 + 6 O2 → 6 CO2 + 6 H2O + energy (ATP). One glucose molecule and six oxygen molecules are consumed; six carbon dioxide, six water and roughly 30–32 ATP come out. It is the summary of the whole pathway, not of any single stage.
C6H12O6 + 6 O2 → 6 CO2 + 6 H2O + energy (ATP)
As a word equation
glucose + oxygen → carbon dioxide + water + energy
This is the photosynthesis equation run backwards, which is why the two are taught together. It balances only for the aerobic pathway: anaerobic respiration in muscle stops at lactate (C6H12O6 → 2 C3H6O3) and in yeast at ethanol and carbon dioxide (C6H12O6 → 2 C2H5OH + 2 CO2), yielding 2 ATP instead of 30–32.
How does the cellular respiration diagram generator work?
Describe the diagram
Say which stages and how much detail you need — a middle-school overview or the electron transport chain complex by complex. The tool knows the pathway, the locations and the ATP arithmetic.
Pick a style
The default is a clean flat textbook plate — white background, labelled arrows and leader lines. Or apply watercolor, ink line art, 3D and other finishes.
Refine and export
The result opens in your workspace, where you can redraw regions, edit labels on the canvas, upscale and export in high resolution.
The three stages at a glance
Inputs, outputs and ATP yield per molecule of glucose. These are the numbers the generator labels a diagram with unless you ask for a different convention.
| Stage | Location | Main inputs | Main outputs | ATP (net) |
|---|---|---|---|---|
| Glycolysis | Cytosol | Glucose, 2 ATP, 2 NAD+ | 2 pyruvate, 2 NADH | 2 |
| Pyruvate oxidation | Mitochondrial matrix | 2 pyruvate, 2 NAD+ | 2 acetyl-CoA, 2 NADH, 2 CO2 | 0 |
| Krebs cycle | Mitochondrial matrix | 2 acetyl-CoA | 4 CO2, 6 NADH, 2 FADH2 | 2 (as GTP) |
| Electron transport chain | Inner mitochondrial membrane | 10 NADH, 2 FADH2, 6 O2 | H2O, regenerated NAD+ and FAD | 26–28 |
| Whole pathway | Cytosol and mitochondrion | 1 glucose + 6 O2 | 6 CO2 + 6 H2O | 30–32 |
Older textbooks total this as 36–38 ATP. The lower modern figure subtracts the energy spent shuttling cytosolic NADH into the mitochondrion and the proton leak across the inner membrane. Tell the generator which convention your syllabus uses and it labels that one.
How are photosynthesis and cellular respiration related?
Photosynthesis and cellular respiration are opposite reactions: the products of one are the reactants of the other. Photosynthesis stores light energy as glucose and releases oxygen; cellular respiration consumes that glucose and oxygen to release the energy as ATP, returning carbon dioxide and water.
| Photosynthesis | Cellular respiration | |
|---|---|---|
| Where | Chloroplast | Cytosol and mitochondrion |
| Reactants | 6 CO2 + 6 H2O + light | C6H12O6 + 6 O2 |
| Products | C6H12O6 + 6 O2 | 6 CO2 + 6 H2O + ATP |
| Energy | Stores light energy in chemical bonds | Releases stored energy as ATP |
| When | Only in light | Continuously, day and night |
| Which organisms | Plants, algae, cyanobacteria | Nearly all living cells |
Plants do both. A common exam mistake is to assume plants only photosynthesise — they respire around the clock in their own mitochondria, and in daylight photosynthesis simply runs faster than respiration, so the plant is a net oxygen producer.
Where are cellular respiration diagrams used?
Cellular respiration diagrams are used mainly in biology teaching — worksheets, revision handouts and lecture slides — and in research figures that need to show where in the pathway an effect happens. What changes between them is the level of detail, not the pathway itself.
School biology
GCSE, A-level, AP and IB worksheets, revision handouts and exam-practice sheets. Usually a full overview plate showing the three stages and their locations, or a single stage blown up for one lesson.
Lectures and textbook plates
Undergraduate slide decks and textbook-style figures, where the electron transport chain is often drawn complex by complex with the proton gradient marked across the inner mitochondrial membrane.
Lab reports and coursework
Respirometry and fermentation practicals need a pathway figure to point at: which step consumes oxygen, where the CO2 being measured is released, why a yeast tube yields ethanol rather than water.
Research figures
Schematic panels in work on mitochondrial disease, cancer metabolism, exercise physiology and drug mechanisms, with the inhibited step or the defective complex marked directly on the pathway.
Common questions about cellular respiration diagrams
What does a cellular respiration diagram show?
A cellular respiration diagram shows the three stages that turn one glucose molecule into ATP, each drawn in the compartment where it happens. Glycolysis in the cytosol splits glucose into two pyruvate (net 2 ATP, 2 NADH); pyruvate oxidation and the Krebs cycle run in the mitochondrial matrix, releasing CO2 and loading NADH and FADH2; the electron transport chain sits on the inner mitochondrial membrane, where oxygen accepts the electrons and most of the ATP is made by oxidative phosphorylation.
What are the reactants and products of cellular respiration?
The reactants are glucose and oxygen; the products are carbon dioxide, water and ATP. Per glucose molecule that is 1 C6H12O6 and 6 O2 in, and 6 CO2, 6 H2O and roughly 30–32 ATP out. Pyruvate, acetyl-CoA, NADH and FADH2 are intermediates — made and consumed inside the pathway, so they never appear in the overall equation.
Where does each stage of cellular respiration take place?
Glycolysis happens in the cytosol; pyruvate oxidation and the Krebs cycle in the mitochondrial matrix; the electron transport chain in the inner mitochondrial membrane. Misplacing these compartments is the most common error in student-drawn diagrams, so the generator anchors every stage to its location by default.
What is the purpose of cellular respiration?
Cellular respiration converts the chemical energy stored in glucose into ATP, the molecule a cell can actually spend. Glucose cannot power a cell directly, while muscle contraction, active transport, protein synthesis and nerve impulses all run on ATP. Cells store very little ATP at any moment, which is why respiration runs continuously rather than in batches.
How many ATP does cellular respiration produce?
About 30–32 ATP per glucose molecule by current estimates, though many textbooks still teach 36–38. The lower figure accounts for the energy spent shuttling cytosolic NADH into the mitochondrion and for proton leak across the inner membrane. Either convention can be labelled — say which one your course uses.
What is the difference between aerobic and anaerobic respiration?
Aerobic respiration uses oxygen as the final electron acceptor and yields roughly 30–32 ATP per glucose; anaerobic respiration and fermentation do not use oxygen and yield 2. Fermentation stops after glycolysis and regenerates NAD+ by making lactate in muscle or ethanol and CO2 in yeast. You can ask for either pathway, or both on one plate.
Can it show photosynthesis and cellular respiration together?
Yes — ask for the two side by side and the generator draws how each one’s products feed the other. Oxygen and glucose leave the chloroplast; carbon dioxide and water come back from the mitochondrion. There is a starter prompt on this page for exactly that paired figure.
Are the molecule labels accurate?
Yes — labels are drawn from a fixed vocabulary and pinned to the correct compartment, so the diagram is gradeable rather than decorative. The vocabulary covers glucose, pyruvate, acetyl-CoA, NADH, FADH2, ATP, ADP, CO2, O2 and H2O, which is what stops a general image model from producing garbled pseudo-text on the leader lines.
How is this different from a general AI image generator?
The pathway is constrained before anything is drawn — stages, compartments, molecule names and ATP arithmetic are fixed rather than invented. A general image model will happily place the Krebs cycle outside the mitochondrion or coin molecule names that do not exist; this tool cannot, because those elements come from a checked vocabulary instead of free composition.
Is the cellular respiration diagram generator free?
Yes to start — every new account gets 100 free credits and no card is required to sign up. That covers generating and exporting real diagrams before you decide whether to buy credits or subscribe. An account is needed because each diagram is saved to a workspace you can return to and edit.
What file formats can I export?
PNG, JPG and PowerPoint (.pptx) from the workspace, plus SVG when you finish the figure in the canvas editor. Raster export runs up to 4K depending on the model, and an upscaler is available if a draft needs bringing up to print resolution.
Can I change the labels after generating?
Yes — the result opens in a canvas workspace that recognises the diagram’s existing labels. You can rewrite or translate label text, adjust arrows, redraw a single region or recolour, all without regenerating the whole figure.
Can I use the diagrams for school, teaching or publication?
Yes — diagrams you generate are yours to use in worksheets, slides, handouts, theses and published papers, with no separate licence to buy. High-resolution raster export runs up to 4K depending on the model you pick.
Sources
Keep exploring
Our other diagram tools, and the guides behind them.
Tools

Draw your cellular respiration diagram
From a one-line description to a labelled pathway figure in about a minute.
Start drawing