
Graphical Abstract Examples
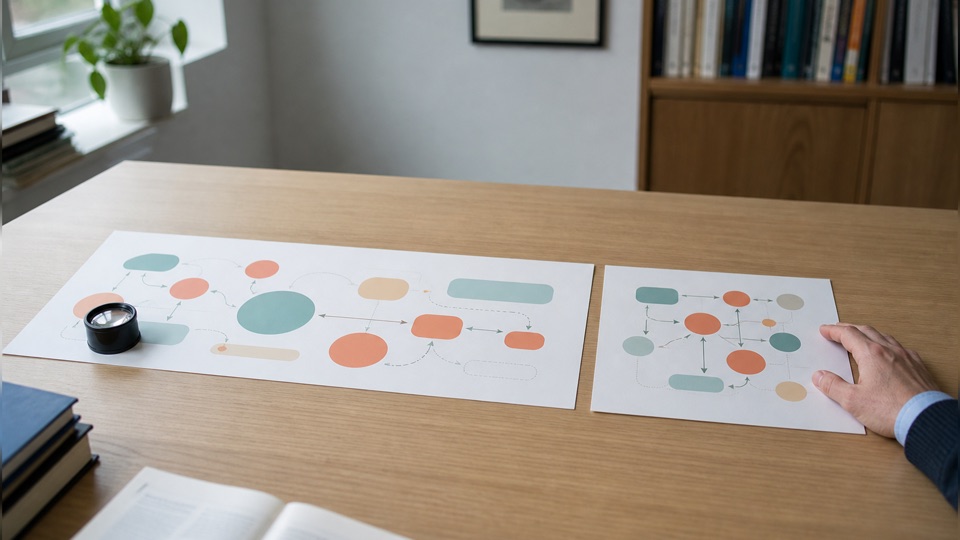
Six journal-style graphical abstracts showing how a paper's story becomes one clear visual flow.
What makes a great graphical abstract
- 1
One panel, one message: if it needs two rows, it needs editing.
- 2
Read direction is left to right — put the intervention early and the outcome last.
- 3
Use 3-5 stages; fewer feels thin, more becomes a flowchart.
- 4
Keep text to short labels; the finding goes in one banner line.
Frequently asked questions
What size do journals require for graphical abstracts?
Elsevier asks for 531×1328 px minimum (about 2.5:1), many others accept 16:9 or square. Generate at 16:9 and use the workspace aspect tool to match your journal's spec.
Can I make one from my actual paper?
Yes — paste your abstract or upload the PDF into our Graphical Abstract Maker. The AI extracts your real stages and findings and renders them with exact labels.
Which style works best?
Flat vector is the safest journal choice; gradient suits computational and materials work; hand-drawn sketch stands out in presentations and social media.
Keep exploring
Our other diagram tools, and the guides behind them.

Create your graphical abstract
Paste your abstract — get a journal-ready visual in minutes.
Open Abstract Maker