
AI Scientific Illustration Generator
Describe any subject and get a publication-ready scientific illustration — botanical plates, anatomical diagrams, line engravings and more.
Scientific illustration style
Nine curated looks for scientific artwork — from vintage botanical plates to isometric scenes and soft 3D renders. Click a card to apply the style, or zoom to see a full example.
What is a scientific illustration?
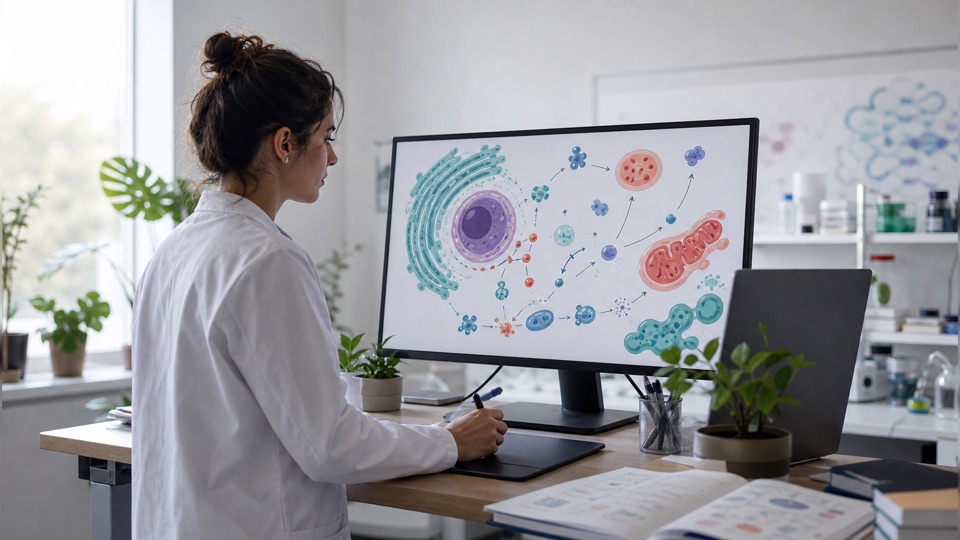
A scientific illustration is a drawing made to communicate a subject accurately rather than attractively — a botanical plate, an anatomical diagram, a labelled cross-section — where every proportion, structure and label is chosen because it is correct, not because it looks good. That constraint is the whole discipline: an illustration may simplify, but it may not invent.
Key facts
- A scientific illustration can show what a photograph cannot: a cutaway, an idealised specimen, or several developmental stages in one plate.
- Simplification is allowed and expected; invention is not. Removing detail is legitimate, adding structures that are not there is not.
- ICMJE requires authors to disclose the use of AI-assisted technologies at submission, and chatbots cannot be listed as authors.
- Publishers differ sharply on generative imagery — some allow it with disclosure, others prohibit it in figures outright.
- Line art destined for print is normally supplied at 600–1200 dpi, higher than the 300 dpi asked of photographs.
How does the scientific illustration generator work?
Describe your subject
Write what the illustration should show — an organism, a structure, a process. A sentence is enough.
Pick a style and model
Choose from nine illustration styles — botanical, anatomical, ink, watercolor, isometric, 3D and more — and your preferred AI model.
Refine in the workspace
The result opens in your workspace where you can redraw regions, recolor, upscale and export in high resolution.
What the generator draws well, and what it does not
Stated plainly, so you can tell before spending credits whether your subject is a good fit.
| Subject | How it does | Notes |
|---|---|---|
| Cell and organelle diagrams | Reliable | Anatomy is constrained; there are dedicated plant, animal and respiration tools |
| Botanical and zoological plates | Reliable | Habit, floral parts and dissections in the classic plate conventions |
| Anatomical diagrams | Reliable | Cross-sections and systems at textbook level |
| Process and mechanism schematics | Reliable | Arrows, stages and labelled steps |
| Lab equipment and apparatus | Usually good | Common glassware and instruments; unusual rigs need description |
| A specific named species | Varies | Well-documented species are close; obscure taxa need reference detail from you |
| Your own unpublished data | Not suitable | It draws schematics, not plots — chart your data in a plotting tool |
| Exact anatomical novelty from your paper | Not suitable | It cannot know a structure that has not been described yet |
Anything the generator has no basis for, it should not be asked to invent. Where a subject is genuinely novel, use the output as a base and correct it on the canvas rather than trusting the first render.
Three ways to get a scientific figure made
Commissioning an illustrator buys judgement and originality; drawing it yourself buys total control at the cost of your time; generating it buys speed. They are not interchangeable, and the right choice depends mostly on how novel your subject is and how many revisions you expect.
| Commission an illustrator | Draw it yourself | Generate it | |
|---|---|---|---|
| Typical turnaround | Days to weeks | Hours to days | About a minute |
| Typical cost | Hundreds of currency units per figure | Your time | A few credits |
| Revisions | Charged, and scheduled | Free but slow | Immediate, on the canvas |
| Subject accuracy | As good as your brief and their research | As good as your own knowledge | Good on documented subjects, weaker on novel ones |
| Style consistency across figures | Excellent | Depends on your skill | Good — the same style applies across a set |
| Genuinely novel structures | The right choice | Workable | Needs correction by you |
| Disclosure obligations | Credit the illustrator | None | Disclose AI use at submission |
For a figure that carries a paper’s central claim about something newly described, commissioning is still the safer route. For everything around it — context diagrams, method schematics, teaching figures — generation is usually enough.
Where are scientific illustrations used?
Most figures in a paper are not plots. Schematics, cross-sections and process diagrams carry the context that makes the data readable, and they are usually the ones nobody has time to draw.
Papers and theses
Method schematics, context diagrams and cross-sections for a figure panel, at the resolution the publisher asks for.
Lectures and teaching
Clean plates on white that stay legible when projected and when photocopied in black and white.
Posters and conference talks
Large-format illustrations that hold up at reading distance, in a consistent style across the whole board.
Grant applications and reports
A single explanatory figure that lets a non-specialist reviewer follow the proposal without reading the methods.
Common questions about scientific illustration
What is a scientific illustration?
A scientific illustration is an accurate, aesthetic depiction of a scientific subject — organisms, anatomy, geology, processes — traditionally drawn by specialist illustrators for textbooks, journals and field guides.
Can AI really produce accurate scientific illustrations?
Modern image models produce impressively accurate and beautiful illustrations from a good description. For publication use, always review scientific details — and use the region redraw tool to fix anything that's off.
Which styles are available?
Nine presets: classic scientific, vintage botanical, medical/anatomical, ink line art, watercolor, flat vector, 2.5D isometric, hand-drawn sketch, and 3D render. Each is tuned with its own prompt so results stay consistent.
Can I use the illustrations in papers and presentations?
Yes — images you generate are yours to use in publications, theses, slides and posters. High-resolution export up to 4K is available depending on the model.
What makes an illustration scientific rather than just a drawing?
Accountability to the subject. Every proportion, structure and label has to be defensible against what is actually known, and where the illustration departs from a real specimen — cutting it open, idealising it, combining stages — the departure must be a recognised convention rather than a convenience. A drawing that looks plausible but shows a structure in the wrong place is not a scientific illustration; it is an error with good lighting.
Can I use AI-generated illustrations in a journal article?
It depends on the publisher, and you must check the specific journal. ICMJE requires authors to disclose the use of AI-assisted technologies at submission, and is explicit that chatbots cannot be listed as authors because they cannot be responsible for the accuracy of the work. Beyond that baseline, policies diverge sharply: some publishers accept generative imagery with disclosure, others prohibit it in figures entirely. Treat the journal’s own guide for authors as the authority.
Do I need to disclose that a figure was AI-generated?
Under the ICMJE recommendations, yes — AI-assisted technologies used in producing submitted work are disclosed at submission, and ICMJE also states that humans remain responsible for any submitted material that involved them. In practice a line in the methods or acknowledgements naming the tool and what it was used for is what journals expect.
What resolution and file format should a scientific figure be?
For print, line art and diagrams are usually supplied at 600–1200 dpi, higher than the 300 dpi normally asked of photographs, because fine strokes and small type alias badly at lower resolutions. TIFF, EPS and PDF are the formats most publishers accept. Check the target journal first — its guide for authors overrides any general rule.
Can it draw a specific named species accurately?
For well-documented species, usually yes — habit, leaf arrangement, floral parts and colouring come out close enough to correct on the canvas. For obscure or recently described taxa, the model has less to work from, and you should supply the distinguishing features in your description rather than assuming they are known. Always check the result against a reference before publishing it.
Can I match my lab’s or journal’s colour scheme?
Yes — name the colours or describe the palette in your prompt, and the illustration is drawn in it. You can also recolour afterwards on the canvas without regenerating, which is the faster route when you already have a figure you are happy with and only the palette needs to change.
Can it produce a figure with several panels?
Yes, though it usually works better to generate each panel separately and assemble them. That way each panel can be corrected on its own, and the labelling (a, b, c) stays under your control rather than being drawn into the image, which matters if a reviewer asks for panels to be reordered.
What is the difference between a scientific illustration and a photograph?
A photograph records one specimen exactly as it was, including the damage, the lighting and whatever was in the way. An illustration shows the subject as it is understood: it can cut the specimen open, remove obscuring structures, idealise an individual into a representative form, or place several developmental stages side by side. Neither is more truthful — they answer different questions, and a paper often needs both.
Sources
- Defining the Role of Authors and Contributors — disclosure of AI-assisted technologies — ICMJE Recommendations
Keep exploring
Our other diagram tools, and the guides behind them.
Tools

Create your first scientific illustration
From description to publication-ready artwork in about a minute.
Start illustrating