
Pedigree Chart Maker
Describe a family and a trait and get a genetic pedigree in standard notation — squares and circles, shaded affected individuals, carrier dots, relationship and sibship lines, generations numbered I, II, III and a proband arrow. Or view the labeled and blank versions below, free.
Or start from an example
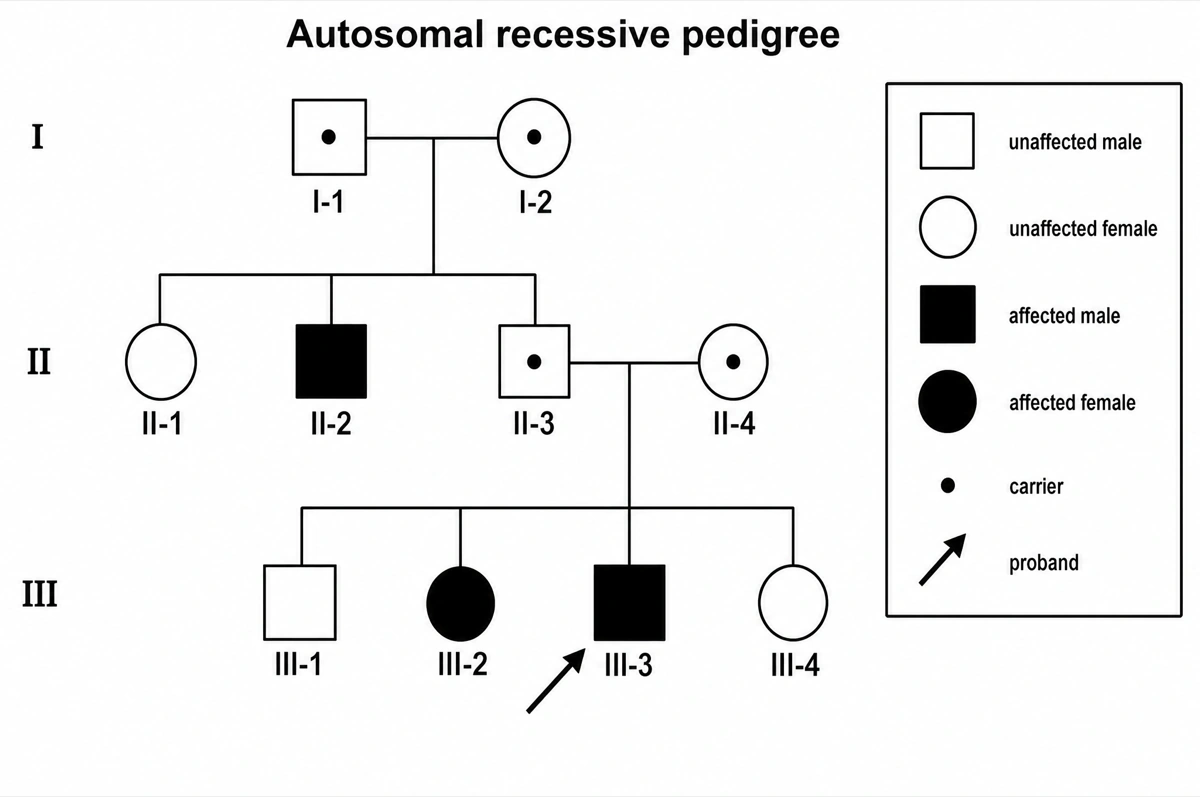
Labeled pedigree chart (answer key)
A three-generation autosomal recessive family: two carrier grandparents, an affected son in generation II, and two carrier parents with two affected children in generation III, with a legend for every symbol. Use it as the answer key or as a pedigree chart template.
Blank pedigree chart to complete
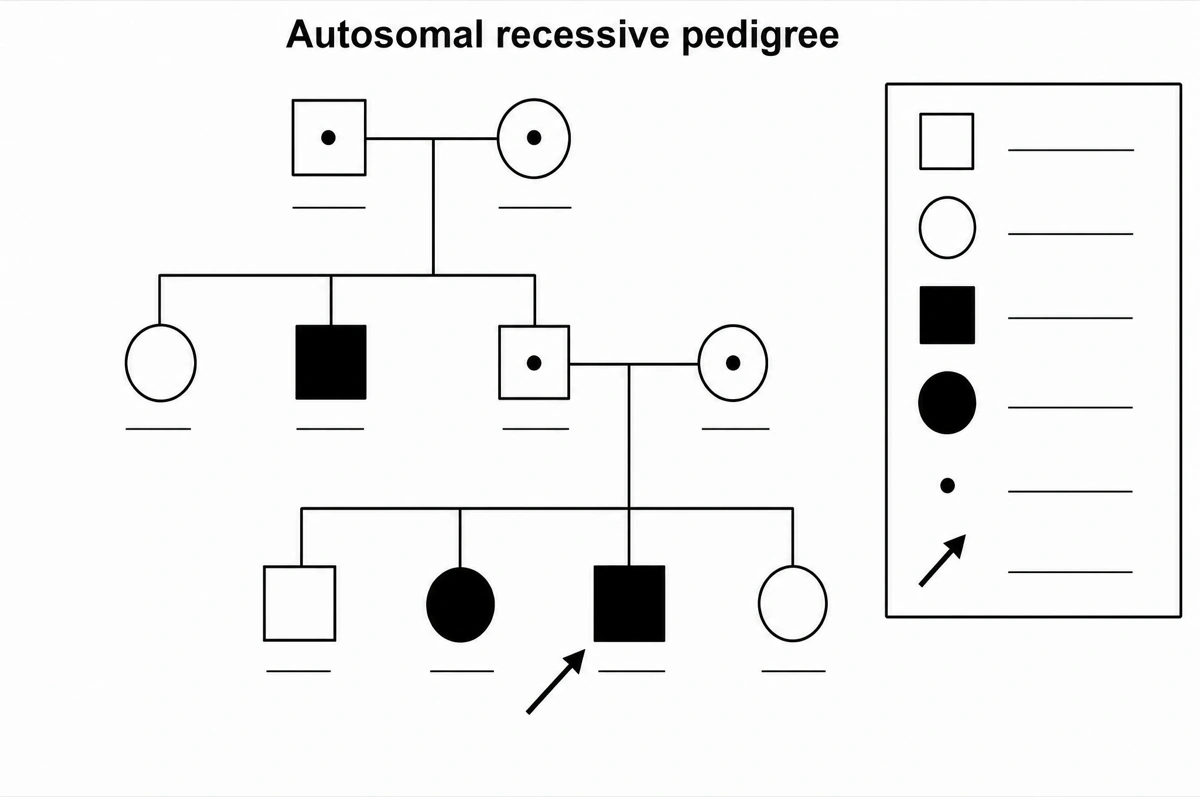
The same pedigree with the generation numerals removed and an empty answer line under every person and beside every legend symbol, ready for a genetics worksheet, a quiz or an exam question on modes of inheritance.
What is a pedigree chart?
A pedigree chart is a diagram of a family across generations that shows who has a genetic trait or condition: males as squares, females as circles, affected individuals shaded, partners joined by a horizontal line and their children hanging below from a sibship line, with the generations numbered I, II, III. The pattern of shaded symbols tells you how the trait is inherited.
Key facts
- The symbols are standardized. The National Society of Genetic Counselors published standard human pedigree nomenclature in 1995 and updated it in 2008 (Bennett et al., J Genet Couns 17:424) and again in 2022; clinics, textbooks and exams follow it.
- Shading means affected; carriers get their own mark. A filled symbol marks someone who has the condition. The 2008 standard puts a dot in the centre of a carrier’s symbol, the convention most textbooks and this page still use; the 2022 update drops the dot for a divided symbol with one part patterned and explained in the legend, and many textbooks simply shade half the symbol.
- Lines carry the relationships. A horizontal relationship line joins partners (a double line if they are blood relatives), a vertical line of descent drops to the sibship line, and siblings hang from it in birth order, oldest on the left.
- Every person has an address. Generations are numbered with Roman numerals from the top and individuals with Arabic numerals from left to right, so II-3 is the third person in generation II. An arrow marks the proband, the person through whom the family came to attention.
- Three generations is the usual minimum. Genetic counselors normally record at least three generations — enough to see whether a condition skips a generation, affects mainly males or passes from father to son.
How does the pedigree chart maker work?
Describe the family
Say how many generations, who is affected and, if you know it, the mode of inheritance — autosomal recessive, autosomal dominant, X-linked. List individuals one by one or give a textbook-style scenario.
Pick a style
The default is a clean black-and-white chart in standard notation, like a textbook or a clinic record. Or add colour for a slide or a poster.
Refine and export
The result opens in your workspace, where you can redraw regions, edit labels on the canvas, upscale and export in high resolution.
Standard pedigree symbols and what they mean
The symbols a pedigree chart is normally expected to use, following the National Society of Genetic Counselors nomenclature. This is the default set unless you ask for another convention.
| Symbol | Meaning | How it is drawn |
|---|---|---|
| Square | Male | An open square |
| Circle | Female | An open circle |
| Diamond | Sex unknown or not specified | An open diamond |
| Filled symbol | Affected — has the condition or trait | The square, circle or diamond shaded solid |
| Dot in the symbol | Carrier (2008 convention) | A small dot in the centre; the 2022 update divides the symbol and patterns one part instead, and many textbooks shade half |
| Diagonal line | Deceased | A line drawn across the symbol |
| Horizontal line between two symbols | Relationship between partners | A single line; a double line if the partners are related by blood |
| Line of descent and sibship line | Children of a couple | A vertical line from the relationship line to a horizontal sibship line, each child hanging from it in birth order |
| Arrow | Proband | An arrow at the lower left of the symbol, with a P |
| Roman and Arabic numerals | Generation and individual | I, II, III down the left; 1, 2, 3 from left to right within each generation |
Put the legend on the chart. A pedigree that shows more than one condition, or half-shaded carriers, must say what each shading means. Name the symbols you need and only those are drawn.
Autosomal recessive vs autosomal dominant: how to tell them apart on a pedigree
In an autosomal recessive pedigree, affected children are usually born to two unaffected carrier parents and the trait can skip generations; in an autosomal dominant pedigree, every affected person has an affected parent and the trait appears in every generation. Both affect males and females about equally, which sets them apart from X-linked inheritance.
| Autosomal recessive | Autosomal dominant | |
|---|---|---|
| Parents of an affected child | Usually both unaffected carriers | At least one affected parent, unless it is a new mutation |
| Across generations | Can skip one or more | Appears in every generation |
| Chance for each child | 25% when both parents are carriers | 50% when one parent is affected |
| Males and females | Affected about equally | Affected about equally |
| Father-to-son transmission | Possible | Possible, which rules out X-linked inheritance |
| Parents related by blood | Often seen; it raises the chance | Not a typical clue |
| Examples | Cystic fibrosis, sickle cell disease, phenylketonuria | Huntington disease, Marfan syndrome, familial hypercholesterolemia |
Check X-linked inheritance before settling on either. If mostly males are affected and no affected father has an affected son, test the X-linked recessive pattern; an affected father whose daughters are all affected and sons all unaffected points to X-linked dominant.
Where are pedigree charts used?
Pedigree charts are used in genetics teaching, genetic counselling and medical research — anywhere a trait has to be traced through a family. The chart is the same; what changes is the detail, from a five-person worksheet to a clinical record with ages and test results.
School and university genetics
Worksheets and exam questions that ask students to identify the mode of inheritance, assign genotypes and work out the chance that the next child is affected, from AP Biology, A-level and IB to first-year genetics.
Genetic counselling
Family histories drawn at the first appointment, usually across at least three generations, to assess risk and decide who should be offered testing.
Case reports and research papers
The family figure in a case report or a gene-discovery paper, showing which relatives were affected and which were tested.
Patient and family education
A clear chart that explains to a family why a condition appeared, who may be a carrier and what the odds are for a future pregnancy.
Common questions about pedigree charts
How do I make a pedigree chart?
Start with the oldest generation at the top: draw each couple as a square and a circle joined by a horizontal line, drop a vertical line to a sibship line, and hang their children from it in birth order; shade everyone who is affected, then number the generations I, II, III and the individuals 1, 2, 3. With this maker you describe the family in plain words and the chart is drawn in that notation.
What do the symbols on a pedigree chart mean?
Squares are males, circles are females and diamonds are individuals of unknown sex; a filled symbol means affected, a dot in the centre (or a half-patterned symbol) means carrier, and a diagonal line means deceased. An arrow marks the proband. The table above lists the full standard set.
Can I get a blank pedigree chart template?
Yes — view the blank version on this page free, or ask for one and every label is replaced by an empty answer line. The labeled version is the matching answer key, so the two print as a pair. Ask for answer lines under each symbol if students should write genotypes.
How do you tell if a trait is dominant or recessive from a pedigree?
If two unaffected parents have an affected child, the trait is recessive; if it shows up in every generation and each affected person has an affected parent, it is most likely dominant. Then check the sexes: mostly affected males and no father-to-son transmission point to X-linked recessive.
How do I work out genotypes on a pedigree?
Start with the people whose genotype is certain: for a recessive trait every affected person is aa, so their unaffected parents and children must be Aa. Fill in the rest from there, writing A_ where the second allele cannot be known. An unaffected child of two carriers has a 2/3 chance of being a carrier.
How are generations and individuals numbered?
Generations take Roman numerals from the top — I, II, III — and individuals take Arabic numerals from left to right within each generation, so every person has a unique label such as III-2.
What is a proband?
The proband is the affected person through whom the family first came to medical attention, marked by an arrow with a P at the lower left of the symbol. The consultand, the person seeking advice, gets an arrow without the P.
Should carriers be half-shaded or shown with a dot?
Either works as long as the legend says which: the 2008 NSGC standard and most textbooks put a dot in the centre of the symbol, while the 2022 NSGC update drops the dot and divides the symbol, filling one part with a pattern named in the legend — which can also show a person who carries more than one condition. Ask for either, and the legend states the one used.
What changed in the 2022 update of the pedigree standard?
The 2022 NSGC update makes the symbol shape reflect gender identity, with sex assigned at birth (AMAB, AFAB or UAAB) written below the symbol, and replaces the carrier dot with a divided symbol whose patterned part is explained in the legend. Ask for this notation if your course or clinic uses it.
Can I use it for dog, horse or family-history pedigrees?
No — this maker draws human genetic pedigrees in medical notation, for tracing a trait or a condition through a family. Animal-breeding pedigrees and genealogy family trees follow different layouts and conventions, and it is not built for them.
How is this different from a generic diagram tool?
The pedigree rules are built in. Generic flowchart and family-tree tools leave every symbol and line to you; here each render is instructed to use the standard symbols, relationship and sibship lines, Roman-numeral generations and a legend. Check the chart against your data before using it; the canvas lets you correct any symbol or label.
Can I use the pedigree charts for school, clinic or publication?
Yes — charts you generate are yours to use in worksheets, slides, case reports and papers. Do not enter the names or other identifying details of real patients; describe people by generation and number instead. Export high-resolution raster up to 4K depending on the model.
Sources
- Standardized human pedigree nomenclature: update and assessment of the recommendations of the National Society of Genetic Counselors — J Genet Couns 17:424–433 (2008) — Bennett RL et al., Journal of Genetic Counseling
- Standardized pedigree nomenclature update centered on sex and gender inclusivity — J Genet Couns 31:1238–1248 (2022) — Bennett RL et al., Journal of Genetic Counseling
- Pedigree — Talking Glossary of Genomic and Genetic Terms — National Human Genome Research Institute
Keep exploring
Our other diagram tools, and the guides behind them.

Draw your pedigree chart
From a description of a family to a pedigree in standard notation in about a minute.
Start drawing