
Insulin Signaling Pathway Diagram Maker
Describe the diagram you need and get the insulin signaling pathway drawn step by step — insulin receptor, IRS-1, PI3K, Akt, GLUT4, glycogen synthesis and the MAPK branch, with activation arrows and inhibition bars.
Insulin signaling pathway examples
Real renders of the prompts shown: the full insulin pathway with GLUT4, glycogen, mTORC1, FOXO1 and MAPK branches, an eight-label overview, insulin resistance and a blank version. Click one to load and edit its prompt.
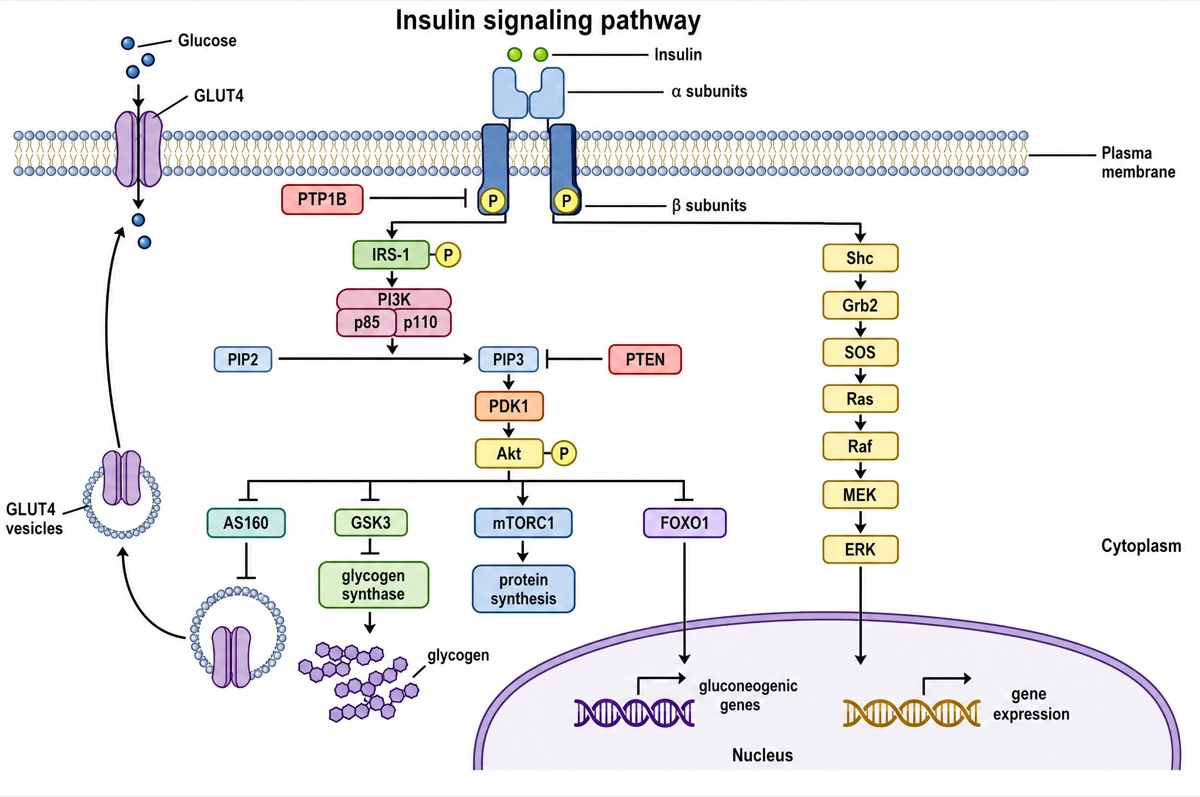
Metabolism on the left, growth on the right
Read down from the receptor, one box per step.
- 1
Insulin → receptor
Bound insulin makes the two β subunits phosphorylate each other.
- 2
IRS-1 → PI3K → PIP3
PI3K docks on IRS-1 and turns PIP2 into PIP3; PTEN reverses it.
- 3
PDK1 → Akt → four targets
GLUT4 moves up, glycogen and protein are made, FOXO1 genes go quiet.
- 4
Shc → Ras → ERK
The right-hand branch carries insulin's growth signal to the genes.
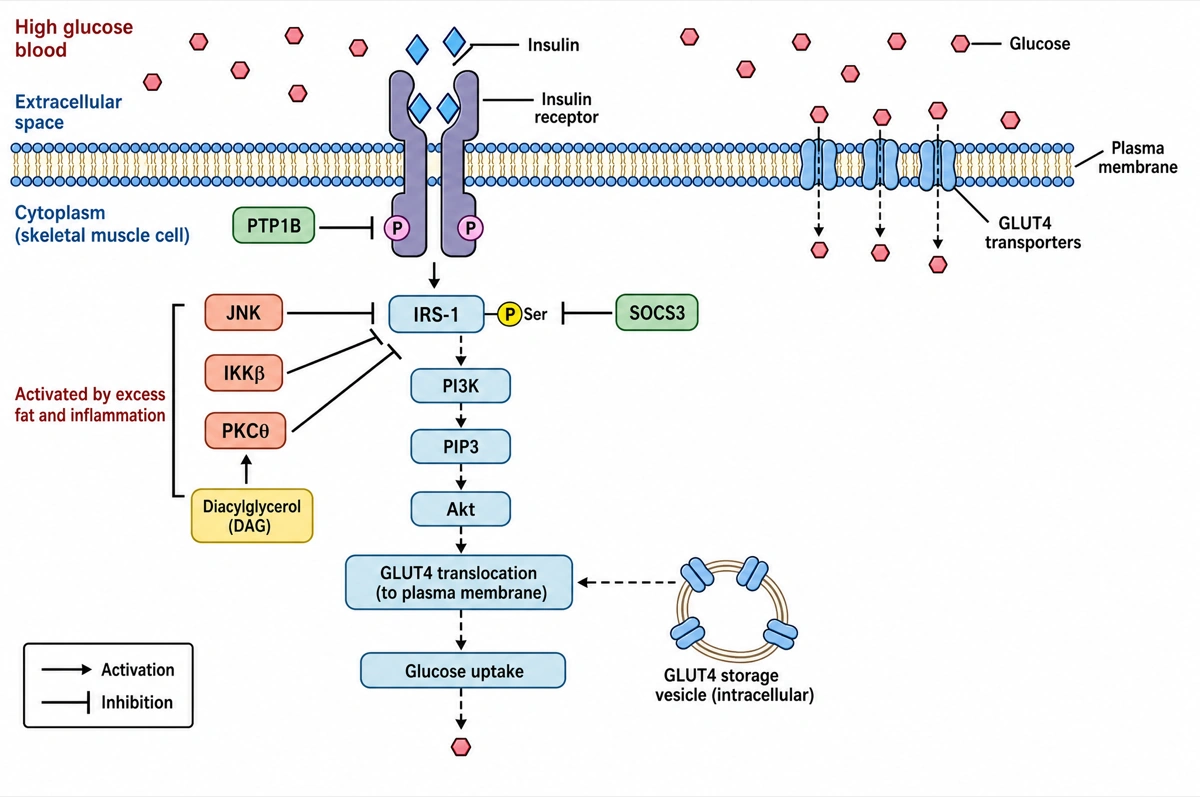
Insulin resistance starts at IRS-1
Dashed arrows mark the weakened signal.
- 1
JNK, IKKβ and PKCθ
Fat and inflammation switch them on, PKCθ via DAG; all bar IRS-1.
- 2
SOCS3 and PTP1B
SOCS3 blocks serine-phosphorylated IRS-1; PTP1B hits the receptor.
- 3
Dashed chain → GLUT4
PI3K and Akt fire weakly, so few GLUT4 reach the membrane.
What is the insulin signaling pathway?
The insulin signaling pathway is the chain of events by which insulin, bound to the insulin receptor tyrosine kinase, phosphorylates IRS proteins and activates PI3K and Akt, which move GLUT4 to the cell surface, switch on glycogen and protein synthesis, and turn down glucose production in the liver. A second branch through Shc, Grb2, Ras and MAPK carries insulin's growth signal.
Key facts
- The insulin receptor is already a tetramer before insulin arrives. Two extracellular α subunits bind insulin and two membrane-spanning β subunits carry the tyrosine kinase; binding brings the two kinase domains together so they phosphorylate each other.
- Most docking sites are on IRS, not on the receptor. The autophosphorylated receptor phosphorylates insulin receptor substrate proteins on many tyrosines, and the p85 regulatory subunit of PI3K binds them through its SH2 domains.
- Akt works mostly by switching other proteins off. It inactivates AS160 (TBC1D4) to release GLUT4 vesicles, inactivates GSK3 so glycogen synthase stays active, and phosphorylates FOXO1 so it leaves the nucleus and the gluconeogenic genes quiet down.
- GLUT4 translocation is the muscle and fat response. Insulin moves GLUT4 to the plasma membrane in skeletal muscle, adipose tissue and heart muscle; in muscle, contraction can do the same through AMPK without insulin.
- Insulin resistance starts at IRS. In obesity and type 2 diabetes, serine/threonine kinases such as JNK, IKKβ and PKCθ phosphorylate IRS-1 on serines, which blunts its signal to PI3K and Akt and so reduces GLUT4 translocation and glycogen synthesis.
How does the insulin signaling pathway diagram maker work?
Describe the diagram
Say what it is for and how deep it should go — the full pathway with the MAPK branch, an eight-label overview, the insulin-resistant state. A sentence is enough.
Pick a style
The default is a clean flat textbook plate — white background, labels on straight leader lines. Or apply watercolor, ink line art, 3D and other finishes.
Refine and export
The result opens in your workspace, where you can redraw regions, edit labels on the canvas, upscale and export in high resolution.
Steps of the insulin signaling pathway and what each one does
The nodes a labeled insulin signaling pathway diagram is normally expected to show, in order, what each one does and what it acts on next. This is the default label set unless you ask for a shorter one.
| Node | What it does | Acts on next |
|---|---|---|
| Insulin | Peptide hormone from pancreatic β cells, released when blood glucose rises | The α subunits of the insulin receptor |
| Insulin receptor (α2β2) | Receptor tyrosine kinase; insulin binding makes its β subunits phosphorylate each other | IRS-1/2 and Shc, on tyrosines |
| IRS-1 and IRS-2 | Docking proteins that carry many phosphotyrosine sites | PI3K (through its p85 subunit) and Grb2 |
| PI3K (p85/p110) | Lipid kinase that turns PIP2 into PIP3 in the inner leaflet of the membrane | PIP3 recruits PDK1 and Akt |
| PDK1 | Phosphorylates Akt at Thr308; mTORC2 adds Ser473 | Akt |
| Akt (PKB) | Serine/threonine kinase at the center of the metabolic branch | AS160, GSK3, FOXO1 and, through TSC2 and Rheb, mTORC1 |
| AS160 (TBC1D4) | Rab-GAP that holds GLUT4 vesicles inside the cell; switched off by Akt | GLUT4 vesicles move to the plasma membrane and fuse with it |
| GLUT4 | Glucose transporter of skeletal muscle, heart muscle and fat cells | Glucose enters the cell |
| GSK3 | Kinase that keeps glycogen synthase inactive; switched off by Akt | Glycogen synthase stays active → glycogen |
| FOXO1 | Transcription factor for gluconeogenic genes; Akt sends it out of the nucleus | Less PEPCK and glucose-6-phosphatase → less glucose from the liver |
| mTORC1 | Growth kinase complex activated downstream of Akt | S6K1 and 4E-BP1 → protein synthesis |
| Shc → Grb2 → SOS → Ras → Raf → MEK → ERK | The mitogenic branch, independent of IRS-1 | Gene transcription and cell growth |
Textbook figures put the muscle and liver branches in one cell, but they happen in different tissues. GLUT4 translocation is the muscle and fat response; FOXO1 and the brake on gluconeogenesis are the liver response. Some introductory texts even say liver cells lack insulin receptors — the liver in fact has one of the highest receptor densities; what it lacks is insulin-dependent glucose uptake. Name the tissue you want and only that branch is drawn.
Insulin vs glucagon signaling: what is the difference?
Insulin signals through a receptor tyrosine kinase and the PI3K–Akt cascade to store fuel and lower blood glucose; glucagon signals through a G protein-coupled receptor, cAMP and protein kinase A to release glucose from the liver and raise it. The two are drawn side by side because they push the same liver enzymes in opposite directions.
| Insulin | Glucagon | |
|---|---|---|
| Made by | β cells of the pancreatic islets | α cells of the pancreatic islets |
| Released when | Blood glucose rises after a meal | Blood glucose falls, and after a protein meal |
| Receptor | Insulin receptor, a receptor tyrosine kinase (α2β2) | Glucagon receptor, a seven-transmembrane GPCR coupled to Gs |
| First relay | IRS phosphorylation → PI3K → PIP3 | Adenylyl cyclase → cAMP |
| Main kinase | Akt (PKB) | Protein kinase A |
| Main targets | Skeletal muscle, fat and liver | Liver |
| Glycogen | Synthesis up: GSK3 off, glycogen synthase on | Breakdown up: glycogenolysis |
| Gluconeogenesis | Suppressed: FOXO1 leaves the nucleus | Stimulated: PKA phosphorylates CREB |
| Blood glucose | Lowered | Raised |
Draw them as two separate cascades, not as one pathway: insulin's arrows end in glycogen synthesis and less gluconeogenesis, glucagon's in glycogen breakdown and more. A glucagon receptor drawn as a tyrosine kinase, or insulin acting through cAMP, is the error to check for first.
Where are insulin signaling pathway diagrams used?
Insulin signaling diagrams are used mostly in physiology, biochemistry and medical teaching, and as model figures in diabetes and metabolism research. What changes between them is the depth: eight labels for a first course, the full cascade with its negative regulators for a medical or graduate one.
Physiology and biochemistry courses
Lectures and exam revision on blood glucose control, where the pathway links the islet hormones to GLUT4, glycogen and gluconeogenesis.
Medical teaching
Pathophysiology of type 2 diabetes and insulin resistance, showing which step fails and why muscle takes up less glucose while the liver keeps making it.
School biology
AP Biology, A-level and IB units on cell signaling that use the insulin receptor as the example of a receptor tyrosine kinase, usually as a simple overview.
Research figures
Graphical abstracts and model figures in diabetes, obesity and metabolism papers, with the protein under study highlighted in the cascade.
Common questions about the insulin signaling pathway
What are the steps of the insulin signaling pathway?
Insulin binds its receptor; the receptor phosphorylates itself and IRS-1; IRS-1 recruits PI3K; PI3K makes PIP3; PIP3 brings PDK1 and Akt to the membrane; and active Akt drives GLUT4 translocation, glycogen synthesis and protein synthesis while switching off gluconeogenesis. In parallel, Shc and Grb2 recruit SOS to activate Ras and the MAPK cascade.
What should a labeled insulin signaling pathway diagram include?
The standard set is insulin, the insulin receptor with its α and β subunits, IRS-1, PI3K, PIP2 and PIP3, PDK1, Akt, AS160, GLUT4, GSK3, glycogen synthase, FOXO1 and mTORC1, plus the Shc–Grb2–SOS–Ras–MAPK branch. Medical and graduate figures add the negative regulators PTP1B and PTEN. Ask for fewer labels and only those are drawn.
How does insulin make GLUT4 move to the cell membrane?
Akt phosphorylates AS160 (TBC1D4), a Rab-GAP that normally keeps GLUT4 vesicles inside the cell; switched off, it lets Rab proteins stay GTP-bound, and the vesicles travel to the plasma membrane and fuse with it. Muscle contraction can trigger the same move through AMPK, without insulin.
How does insulin increase glycogen synthesis?
Akt phosphorylates and inactivates GSK3, the kinase that keeps glycogen synthase switched off, so glycogen synthase stays active. Protein phosphatase 1 adds to this by dephosphorylating glycogen synthase and inactivating glycogen phosphorylase, so glycogen breakdown slows at the same time.
How does insulin stop the liver from making glucose?
Akt phosphorylates the transcription factor FOXO1, which leaves the nucleus, so the genes for gluconeogenic enzymes are switched down. Insulin lowers the expression of PEPCK, fructose-1,6-bisphosphatase and glucose-6-phosphatase and raises glucokinase and pyruvate kinase, shifting the liver from making glucose to storing it.
What goes wrong in the insulin signaling pathway in insulin resistance?
The signal is cut near the top: serine/threonine kinases such as JNK, IKKβ and PKC phosphorylate IRS-1 on serines, mTOR signaling speeds IRS-1 degradation, and phosphatases such as PTP1B and PTEN are more active, so PI3K and Akt are activated less. The result is less GLUT4 translocation and glycogen synthesis in muscle and more gluconeogenesis in the liver. In muscle, fat-derived diacylglycerol activates PKCθ; in the liver, PKCε.
What are the negative regulators of insulin signaling?
PTP1B dephosphorylates the insulin receptor, PTEN turns PIP3 back into PIP2, SOCS proteins bind the signaling complex and block IRS-1, and serine phosphorylation of IRS-1 shuts the signal down at its source. One of those serine kinases is S6K1, downstream of mTORC1, which makes a built-in negative feedback loop.
What is the difference between the insulin signaling pathway and the PI3K/AKT pathway?
The PI3K/AKT pathway is the general module that many growth factors use; the insulin signaling pathway is one way into it, through the insulin receptor and IRS proteins, read out mainly as metabolism — GLUT4, glycogen and gluconeogenesis. For the generic module as cell biology and cancer draw it, with TSC2, mTORC1, BAD and MDM2, use the PI3K/AKT signaling pathway diagram maker.
How is this different from a generic AI image tool?
The subject brief is built in. Every render is instructed to draw the cascade top to bottom with the receptor in the membrane and the nucleus at the bottom, activation as arrows, inhibition as flat-headed bars and phosphorylation as a circled P, with each label spelled exactly. Check the nodes against your course before printing; the canvas lets you correct any in place.
Can I use the diagrams for school, teaching or publication?
Yes — diagrams you generate are yours to use in worksheets, presentations, handouts, theses and papers. Export high-resolution raster up to 4K depending on the model.
Can I change the labels after generating?
Yes. The result opens in a canvas workspace that recognizes the diagram labels — you can edit or translate the text, move leader lines, redraw a region or recolor without regenerating the whole figure.
Sources
- Insulin signaling pathway (hsa04910) — KEGG PATHWAY
- Translocation of SLC2A4 (GLUT4) to the plasma membrane — Reactome
- Insulin resistance (hsa04931) — KEGG PATHWAY
- Biochemistry, Insulin Metabolic Effects — StatPearls — NCBI Bookshelf
Keep exploring
Our other diagram tools, and the guides behind them.

Draw your insulin signaling pathway diagram
From a one-line description to a labeled, printable pathway in about a minute.
Start drawing