
PI3K/AKT Signaling Pathway Diagram Maker
Describe the diagram you need and get the PI3K/AKT pathway drawn top to bottom — receptor, PI3K, PIP3 and PTEN, AKT (Akt/PKB) phosphorylated at Thr308 and Ser473, and its targets from mTORC1 to BAD — with activation arrows and inhibition bars.
PI3K/AKT signaling pathway examples
Real renders of the prompts shown: the full PI3K/AKT cascade to mTORC1, BAD, FOXO and MDM2, an eight-label overview, cancer mutations and targeted drugs, and a blank version. Click one to load and edit its prompt.
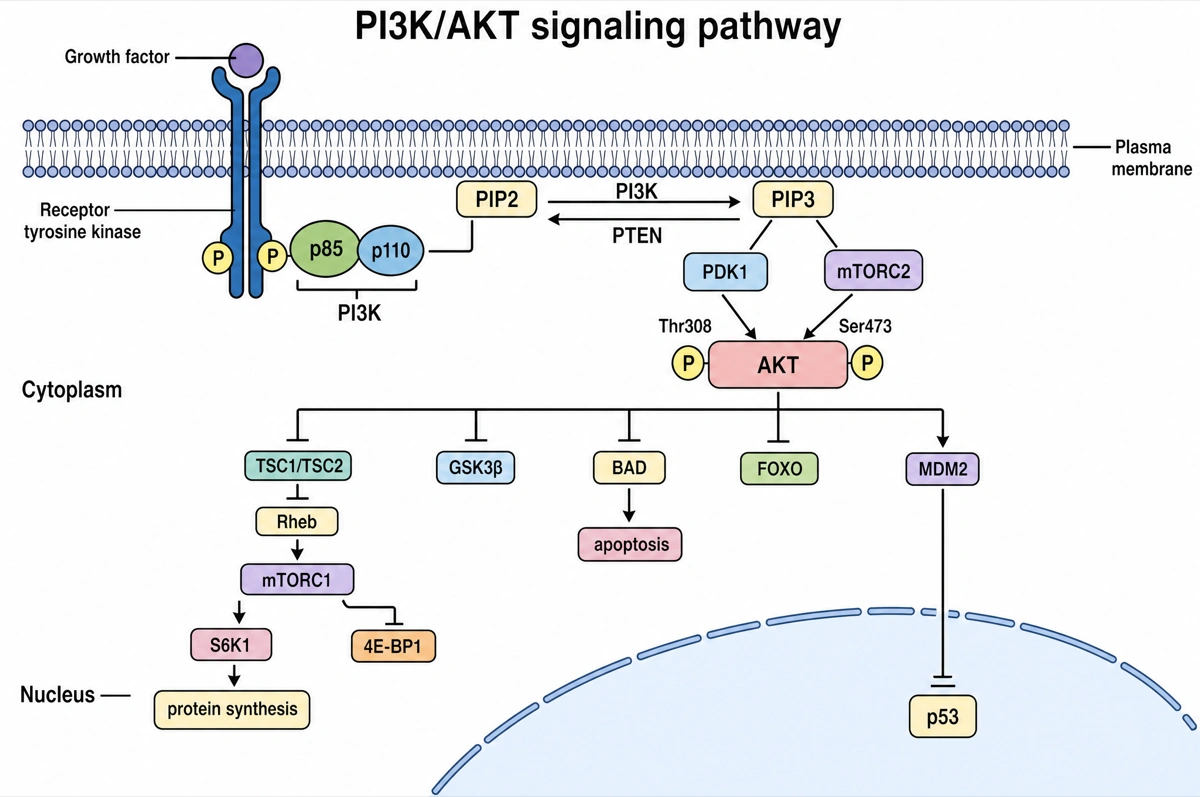
AKT turns on to turn its targets off
Read down; a flat bar means AKT switches it off.
- 1
Receptor → PI3K
The active receptor docks p85; p110 is the catalytic subunit.
- 2
PIP2 ⇄ PIP3
PI3K makes PIP3 at the membrane; PTEN turns it back into PIP2.
- 3
PDK1 + mTORC2 → AKT
They phosphorylate AKT at Thr308 and Ser473, making it fully active.
- 4
AKT's five targets
TSC1/TSC2, GSK3β, BAD and FOXO switched off; MDM2 on, against p53.
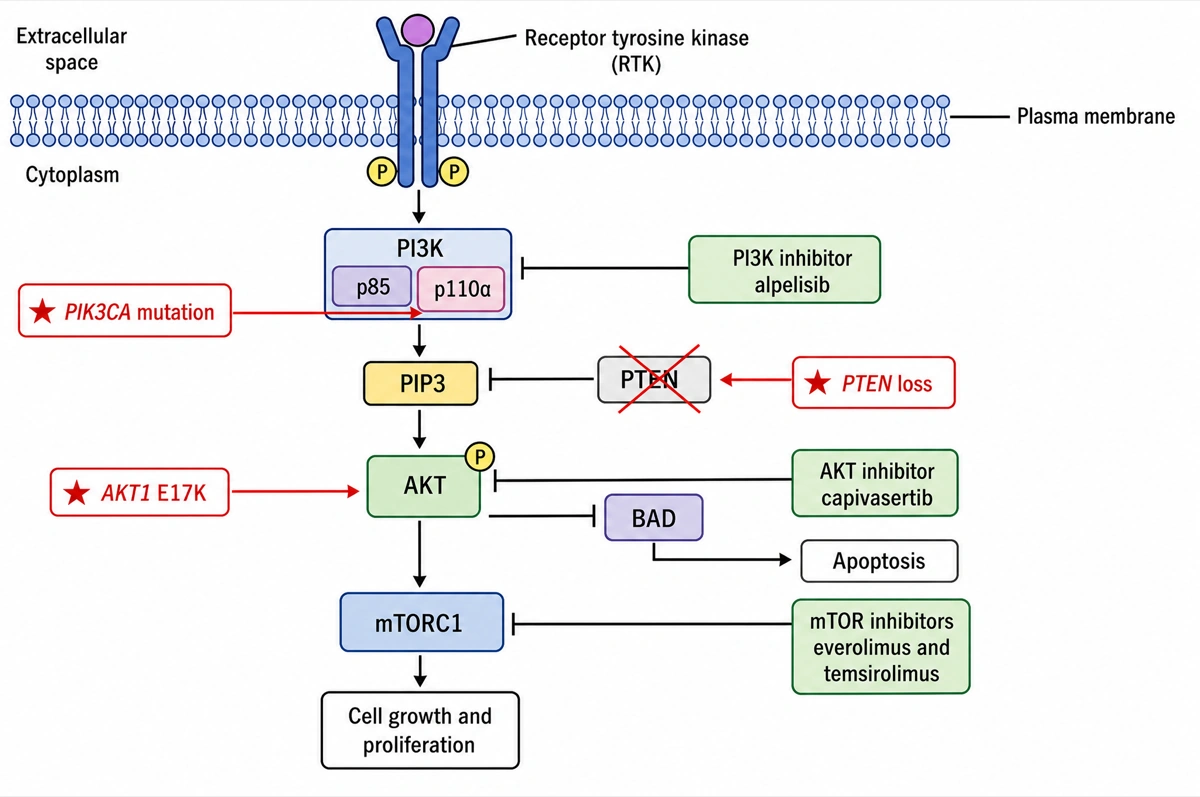
Locked on by mutation, blocked by drugs
Red stars: mutations. Green boxes: drugs.
- 1
PI3K (p110α)
A PIK3CA mutation keeps p110α on; alpelisib bars PI3K.
- 2
PTEN, crossed out
With PTEN lost, PIP3 is no longer cleared.
- 3
AKT and mTORC1
AKT1 E17K drives AKT; capivasertib bars AKT, everolimus bars mTORC1.
What is the PI3K/AKT signaling pathway?
The PI3K/AKT signaling pathway is the module in which an activated receptor recruits class I PI3K, PI3K converts PIP2 into PIP3 at the membrane, and PIP3 brings AKT to PDK1 and mTORC2, which phosphorylate it so it can switch on mTORC1 and switch off TSC2, GSK3β, FOXO and BAD. Its outputs are cell growth, survival and metabolism; the phosphatase PTEN turns it off.
Key facts
- Class I PI3K is a two-part enzyme. A p85 regulatory subunit keeps the p110 catalytic subunit inactive until its SH2 domains bind phosphotyrosines on an activated receptor or adaptor; receptor tyrosine kinases activate class IA isoforms and G protein-coupled receptors class IB.
- PIP3 is the signal, and PTEN erases it. PI3K adds a phosphate at the 3 position of the inositol ring of PIP2; PTEN takes it off again, so losing PTEN leaves PIP3 — and AKT — switched on.
- AKT needs two phosphates to be fully active. PDK1 phosphorylates Thr308 and mTORC2 phosphorylates Ser473 (numbering of AKT1). Reactome puts Ser473 first, as the step that lets PDK1 reach Thr308; older textbooks, such as the 2002 edition of Alberts' Molecular Biology of the Cell, show PDK1 alone.
- AKT mostly works by switching its targets off. Phosphorylation inactivates TSC2, so Rheb can activate mTORC1, and inactivates GSK3β, the FOXO transcription factors (exported from the nucleus) and the pro-apoptotic protein BAD (held by 14-3-3); MDM2 is the exception, sent into the nucleus to degrade p53.
- It is often switched on permanently in cancer. Gain-of-function mutations in PIK3CA (p110α) and PIK3R1 (p85α), the rare AKT1 E17K mutation and loss-of-function mutations in PTEN all keep the pathway active without a growth factor.
How does the PI3K/AKT pathway diagram maker work?
Describe the diagram
Say what it is for and how deep it should go — the full module with all five AKT targets, an eight-label overview, the cancer version with drug targets. A sentence is enough.
Pick a style
The default is a clean flat textbook plate — white background, labels on straight leader lines. Or apply watercolor, ink line art, 3D and other finishes.
Refine and export
The result opens in your workspace, where you can redraw regions, edit labels on the canvas, upscale and export in high resolution.
Components of the PI3K/AKT pathway and what each one does
The nodes a labeled PI3K/AKT pathway diagram is normally expected to show, in order, what each one does and what it acts on next. This is the default label set unless you ask for a shorter one.
| Node | What it does | Acts on next |
|---|---|---|
| Receptor tyrosine kinase or GPCR | Binds a growth factor or other ligand and becomes active | Recruits PI3K: an RTK through phosphotyrosines, a GPCR through Gβγ |
| Class I PI3K (p85/p110) | Lipid kinase; p85 binds the receptor, p110 phosphorylates PIP2 | Makes PIP3 |
| PIP3 | Lipid messenger in the inner leaflet of the plasma membrane | Recruits PDK1 and AKT through their PH domains |
| PTEN | Lipid phosphatase and tumor suppressor | Turns PIP3 back into PIP2, switching AKT off |
| PDK1 and mTORC2 | Phosphorylate AKT at Thr308 (PDK1) and Ser473 (mTORC2) | Fully active AKT |
| AKT (AKT1, AKT2, AKT3) | Serine/threonine kinase that leaves the membrane to phosphorylate its targets | TSC2, GSK3β, FOXO, BAD, MDM2 |
| TSC1/TSC2 | GAP complex that keeps Rheb in its inactive GDP-bound form; inhibited by AKT | Rheb |
| Rheb → mTORC1 | GTP-bound Rheb activates mTORC1 | S6K1 and 4E-BP1 → protein synthesis and cell growth |
| GSK3β | Kinase inhibited by AKT | Glycogen synthase and other metabolic targets |
| FOXO | Transcription factors exported from the nucleus once AKT phosphorylates them | Genes for apoptosis, cell-cycle arrest and glucose metabolism go quiet |
| BAD | Pro-apoptotic protein; held by 14-3-3 once AKT phosphorylates it | Apoptosis blocked, cell survival |
| MDM2 | E3 ubiquitin ligase; AKT phosphorylation sends it into the nucleus | p53 degraded |
Draw AKT's targets as inhibition bars, not arrows — except MDM2. TSC2, GSK3β, FOXO and BAD are all inactivated when AKT phosphorylates them, so mTORC1 is switched on by a double negative (AKT ⊣ TSC2 ⊣ Rheb). A diagram with plain arrows from AKT to every target gets four of the five backwards.
PI3K/AKT vs Ras/MAPK: what is the difference?
Both start at the same activated receptor tyrosine kinases, but PI3K/AKT relays the signal through a membrane lipid, PIP3, and one kinase, AKT, to control growth, survival and metabolism, while Ras/MAPK relays it through a GTPase switch and a three-kinase cascade, Raf → MEK → ERK, mainly to control proliferation and differentiation through gene transcription. The two cross-talk: GTP-bound Ras can bind and activate p110.
| PI3K/AKT | Ras/MAPK | |
|---|---|---|
| Adaptor at the receptor | p85 subunit of PI3K, through its SH2 domains | Grb2, bound to the GEF SOS; Shc on some receptors |
| Relay | Lipid messenger PIP3 in the inner membrane leaflet | Small GTPase Ras, active when GTP-bound |
| Kinase steps | PDK1 and mTORC2 → AKT | Raf → MEK1/2 → ERK1/2 |
| Main outputs | Cell growth (mTORC1), survival (BAD, FOXO), metabolism | Proliferation and differentiation, immediate early gene transcription |
| Switched off by | PTEN removing the 3-phosphate from PIP3 | GAPs speeding GTP hydrolysis by Ras |
| Typical cancer changes | PIK3CA and PIK3R1 gain of function, PTEN loss, AKT1 E17K | Hyperactive RAS mutants, BRAF V600E |
| Approved inhibitors | Alpelisib, inavolisib, idelalisib (PI3K); capivasertib (AKT); everolimus, temsirolimus (mTOR) | Vemurafenib (BRAF V600E); trametinib (MEK1/2) |
Draw them as two branches from one receptor, not one line, with Ras able to feed into PI3K. The insulin signaling pathway is the classic teaching example of the split: its IRS–PI3K–AKT branch carries the metabolic effects and its Shc–Grb2–Ras branch the growth effects.
Where are PI3K/AKT pathway diagrams used?
PI3K/AKT diagrams are used in cell biology and cancer teaching, in pharmacology lectures on targeted therapy, and as model figures in cancer and metabolism papers. What changes between them is the depth: an eight-label overview for a first course, all five AKT targets and the drug classes for an advanced one.
Cell biology courses
Signal transduction lectures that use the pathway as the standard example of a lipid second messenger and of a kinase that acts by inhibiting its targets.
Cancer biology
Teaching on oncogenes and tumor suppressors — PIK3CA as the oncogene, PTEN as the tumor suppressor — and on why tumors with these changes are candidates for targeted drugs.
Pharmacology
Slides mapping each approved inhibitor to its node: PI3K inhibitors such as alpelisib, the AKT inhibitor capivasertib and the rapalogs everolimus and temsirolimus on mTORC1.
Research figures
Graphical abstracts and model figures in cancer, metabolism and aging papers, with the node under study highlighted in the cascade.
Common questions about the PI3K/AKT pathway
What are the steps of the PI3K/AKT pathway?
A growth factor activates its receptor; PI3K docks on it and turns PIP2 into PIP3; PIP3 recruits AKT and PDK1 to the membrane; mTORC2 phosphorylates AKT at Ser473 and PDK1 phosphorylates it at Thr308; and active AKT phosphorylates TSC2, GSK3β, FOXO, BAD and MDM2. PTEN reverses the second step by turning PIP3 back into PIP2.
What does PTEN do in the PI3K/AKT pathway?
PTEN is a lipid phosphatase that removes the 3-phosphate from PIP3, turning it back into PIP2 and so switching AKT off. It is the direct opposite of PI3K, which is why PTEN is drawn beside PI3K at the membrane with an arrow from PIP3 back to PIP2.
Why do PTEN loss and PIK3CA mutations activate the pathway in cancer?
Both leave PIP3 high without a growth factor: activating PIK3CA mutations free p110α from the brake of p85 or lock it in an active shape, and PTEN loss removes the phosphatase that would clear the PIP3. Either way AKT stays active, and cells keep growing and resist apoptosis. The rare AKT1 E17K mutation does the same further down by letting AKT bind PIP2 and be activated without PI3K.
How does AKT activate mTORC1?
Indirectly: AKT phosphorylates TSC2 and breaks up the TSC1/TSC2 complex, a GAP that keeps Rheb inactive, so GTP-bound Rheb accumulates and activates mTORC1. mTORC1 then phosphorylates S6K1, which activates ribosomal protein S6, and 4E-BP1, which releases eIF4E for translation.
What is the difference between mTORC1 and mTORC2?
mTORC1 (with Raptor) sits downstream of AKT and drives protein synthesis and cell growth; mTORC2 (with Rictor) sits upstream, phosphorylating AKT at Ser473. Rapamycin and the rapalogs inhibit only mTORC1, because Rictor masks the rapamycin-binding site in mTORC2.
Which drugs target the PI3K/AKT/mTOR pathway?
Three classes are approved: PI3K inhibitors (alpelisib and inavolisib for PIK3CA-mutant breast cancer, idelalisib for PI3Kδ in chronic lymphocytic leukemia), the AKT inhibitor capivasertib, and the mTOR inhibitors everolimus and temsirolimus. Capivasertib, approved in 2023, is used with fulvestrant for breast cancer with PIK3CA, AKT1 or PTEN alterations.
Why do PI3K and AKT inhibitors raise blood sugar?
Insulin uses the same PI3K–AKT steps to move GLUT4 to the cell surface and to hold back glucose production in the liver, so blocking them blocks part of insulin's action. The alpelisib label warns of severe hyperglycemia and asks for fasting glucose and HbA1c to be checked before treatment starts.
What is the difference between the PI3K/AKT pathway and the insulin signaling pathway?
The insulin signaling pathway is one route into the PI3K/AKT module — through the insulin receptor and IRS proteins — read out as metabolism: GLUT4, glycogen and gluconeogenesis. This page draws the generic module used by many growth factors, with mTORC1, BAD and MDM2; for the physiological version use the insulin signaling pathway diagram maker.
How is this different from a generic AI image tool?
The subject brief is built in. Every render is instructed to draw the cascade top to bottom with the receptor in the membrane and the nucleus at the bottom, activation as arrows, inhibition as flat-headed bars and phosphorylation as a circled P, with each label spelled exactly. Check the nodes against your course before printing; the canvas lets you correct any in place.
Can I use the diagrams for school, teaching or publication?
Yes — diagrams you generate are yours to use in worksheets, presentations, handouts, theses and papers. Export high-resolution raster up to 4K depending on the model.
Can I change the labels after generating?
Yes. The result opens in a canvas workspace that recognizes the diagram labels — you can edit or translate the text, move leader lines, redraw a region or recolor without regenerating the whole figure.
Sources
Keep exploring
Our other diagram tools, and the guides behind them.

Draw your PI3K/AKT pathway diagram
From a one-line description to a labeled, printable pathway in about a minute.
Start drawing